doi: 10.56294/dm2023171
ORIGINAL
Convolutional Neural Network-Based Approach For Skin Lesion Classification
Enfoque basado en redes neuronales convolucionales para la clasificación de lesiones cutáneas
Mariame Oumoulylte1 *, Ali Omari Alaoui2 *, Yousef Farhaoui2 *, Ahmad El Allaoui2 *, Abdelkhalak Bahri1 *
1Laboratory of Applied Sciences; Team: SDIC. National School of Applied Sciences Al-Hoceima, Abdelmalek Esaadi University Tétouan, Morocco
2L-STI, T-IDMS, FST Errachidia, Moulay Ismail University of Meknes Errachidia
Cite as: Oumoulylte M, Omari Alaoui A, Farhaoui Y, El Allaoui A, Bahri A. Convolutional Neural Network-Based Approach For Skin Lesion Classification. Data and Metadata. 2023;2:171.https://doi.org/10.56294/dm2023171
Submitted: 29-08-2023 Revised: 29-09-2023 Accepted: 01-12-2023 Published: 27-12-2023
Editor:
Prof.
Dr. Javier González Argote ![]()
Guest Editor: Yousef
Farhaoui ![]()
Note: Paper presented at the International Conference on Artificial Intelligence and Smart Environments (ICAISE’2023).
ABSTRACT
Skin cancer represents one of the primary forms of cancer arising from various dermatological disorders. It can be further categorized based on morphological characteristics, coloration, structure, and texture. Given the rising incidence of skin cancer, its significant mortality rates, and the substantial costs associated with medical treatment, the imperative lies in early detection to promptly diagnose symptoms and initiate appropriate interventions. Traditionally, skin cancer diagnosis and detection involve manual screening and visual examination conducted by dermatologists. these techniques are complex, error-prone, and time-consuming. Machine learning algorithms, particularly deep learning approaches, have been applied to analyze images of skin lesions, detect potential cancerous growths, and provide predictions regarding the likelihood of malignancy. In this paper, we have developed an optimized deep convolutional neural network (DCNN) specifically tailored for classifying skin lesions into benign and malignant categories. Thereby, enhancing the precision of disease diagnosis. Our study encompassed the utilization of a dataset comprising 3,297 dermoscopic images. To enhance the model’s performance, we applied rigorous data preprocessing techniques and softmax activation algorithms. The suggested approach employs multiple optimizers, including Adam, RMSProp, and SGD, all configured with a learning rate of 0.0001. The outcomes of our experiments reveal that the Adam optimizer outperforms the others in distinguishing benign and malignant skin lesions within the ISIC dataset, boasting an accuracy score of 84 %, a loss rate of 32 %, a recall rating of 85 %, a precision score of 85 %, a f1-score of 85 %, and a ROC-AUC of 83 %.
Keywords: Skin Cancer; Convolutional Neural Network; Deep Learning; Medical Images.
RESUMEN
El cáncer de piel representa una de las formas primarias de cáncer derivado de diversos trastornos dermatológicos. Puede clasificarse en función de sus características morfológicas, coloración, estructura y textura. Dado el aumento de la incidencia del cáncer de piel, sus elevadas tasas de mortalidad y los considerables costes asociados al tratamiento médico, la detección precoz es imprescindible para diagnosticar rápidamente los síntomas e iniciar las intervenciones adecuadas. Tradicionalmente, el diagnóstico y la detección del cáncer de piel implican el cribado manual y el examen visual realizado por dermatólogos. estas técnicas son complejas, propensas a errores y consumen mucho tiempo.Los algoritmos de aprendizaje automático, en particular los enfoques de aprendizaje profundo se han aplicado para analizar imágenes de lesiones cutáneas, detectar posibles crecimientos cancerosos y proporcionar predicciones sobre la probabilidad de malignidad. En este artículo, hemos desarrollado una red neuronal convolucional profunda optimizada (DCNN) específicamente diseñada para clasificar las lesiones cutáneas en categorías benignas y malignas. De este modo, se mejora la precisión del diagnóstico de la enfermedad. Nuestro estudio abarcó la utilización de un conjunto de datos compuesto por 3.297 imágenes dermatoscópicas. Para mejorar el rendimiento del modelo, aplicamos rigurosas técnicas de preprocesamiento de datos y algoritmos de activación softmax. El enfoque sugerido emplea múltiples optimizadores, incluidos Adam, RMSProp y SGD, todos ellos configurados con una tasa de aprendizaje de 0,0001. Los resultados de nuestros experimentos revelan que el optimizador Adam supera a los demás en la distinción de lesiones cutáneas benignas y malignas en el conjunto de datos ISIC, con una puntuación de precisión del 84 %, una tasa de pérdida del 32 %, un índice de recuerdo del 85 %, una puntuación de precisión del 85 %, una puntuación f1 del 85 % y un ROC-AUC del 83 %.
Palabras clave: Cáncer de Piel; Redes Neuronales Convolucionales; Aprendizaje Profundo; Imágenes Médicas.
INTRODUCTION
Skin cancer is a form of cancer that originates in the skin cells. It is one of the most prevalent cancer types globally, with millions of diagnoses yearly.(1) The cancer begins when normal cells undergo changes and start to increase uncontrollably, forming a mass known as a tumor. Tumors can be categorized as cancerous (malignant) or non-cancerous (benign). Malignant tumors can expand and metastasize to other body regions, while benign tumors may grow but do not spread.
The timely detection of skin cancer allows for effective treatment, which typically involves topical medications, in-office dermatological procedures, or outpatient surgical interventions. Initially, skin cancer is often identified through visual inspection, and subsequently, early diagnosis through dermoscopic analysis can lead to a near 100 % curability rate.(2,3) The precise identification of skin cancer presents a significant challenge for dermatologists, even when using dermoscopy images, primarily because various types of skin cancer can initially appear quite similar. Additionally, even highly skilled dermatologists may encounter limitations in accurately diagnosing skin cancer, as their expertise is limited to a specific subset of potential skin cancer presentations throughout their careers. Similarly, less experienced dermatologists using dermoscopy may experience reduced accuracy in identifying skin cancer. Thus, reducing the complications of the treatment process and preserving lives requires an automated system able to detect exactly and accurately skin cancer earlier.(4)
Computer vision with deep neural networks and CNN-based approaches are among many challenges of image processing and are frequently utilized in skin cancer identification and classification. In addition to deep learning, machine learning, and hybrid approaches are employed. These methods have demonstrated their effectiveness as classifiers for skin lesions and have shown promising outcomes in the early detection of skin cancer.
The primary objective of this research is to develop automated tools that assist dermatologists in accurately diagnosing skin lesions. To accomplish this, we've developed a convolutional neural network (CNN) model which has been trained and tested using the International Skin Image Collaboration (ISIC) archive dataset.(5) This model enables the classification and identification of the categories to which each element in the dataset belongs, distinguishing between benign and malignant lesions.
Related work
Melanoma is a lethal form of skin cancer responsible for claiming thousands of lives worldwide.(6) In recent years, substantial efforts have been dedicated to saving lives by enabling early detection. Various machine-learning approaches have been put forth for the segmentation and classification of skin lesions, aiming to enhance the chances of identifying melanoma at its earliest and most treatable stages.
In their study, Ogundokun et al.(7) introduced an innovative approach to skin cancer identification. They proposed a hybrid deep convolutional neural network architecture that combines the strengths of the Xception and MobileNetV2 models. To address the challenge of imbalanced datasets, they implemented data augmentation techniques. Furthermore, they employed transfer learning to overcome the limitations posed by the lack of labeled datasets. The results of their suggested method were outstanding, achieving remarkable performance metrics, including a 97,56 % accuracy rate, a 97,00 % area under the curve, 100 % sensitivity, 93,33 % precision, a 96,55 % F1 score, and an impressively low false positive rate of 0.0370.
Nigar et al.(8) developed a CNN model that identified six different skin diseases namely, actinic keratosis, benign keratosis, melanoma, basal cell carcinoma, insect bite, and skin acne, this model achieved an accuracy rate of 97 %, with precision of 91 %, recall 91 % and F1-score 91 %. To automatically differentiate between melanoma and non-melanoma skin cancer types.
Jaisakthi et al.(9) introduced an Efficient Net-based architecture for transfer learning. They assessed the system's performance using the Area under the ROC curve (AUC-ROC) and achieved an impressive score of 0.9681 through optimal fine-tuning of EfficientNet-B6 with the Ranger optimizer.
Hameed et al.(10) proposed a classification technique for the categorization of skin lesions into seven distinct classes. Their approach involved utilizing data augmentation and image preparation methods. Within the realm of Dermatology pigmented lesion classification. The researchers introduced several techniques to differentiate between melanocytic lesions and normal ones. Their model achieved a remarkable accuracy rate of 92,5 %. A comparative analysis of their results against previously published methods using the same dataset underscored the effectiveness and the potential superiority of their approach.
Bozkurt(11) proposed a pre-trained deep-learning approach known as Inception-Resnet-v2 for skin lesion classification. The research specifically investigated the impact of data augmentation techniques on the performance of the skin cancer classification system. Notably, the highest reported accuracy in this study was 95,09 % when utilizing the Inception-Resnet-v2 model with an augmented dataset. In contrast, the same model achieved an accuracy of 83,59 % when applied to the original, non-augmented dataset. This finding highlights the significant improvement achieved through data augmentation in skin lesion classification.
Saifan et al.(12) introduced a system centered on the utilization of a pre-trained deep convolutional neural network to differentiate between six skin diseases: acne, athlete's foot, chickenpox, eczema, skin cancer and vitiligo. To support their research, the authors curated a dataset comprising 3,000 color images, drawing from various online sources and the Internet. In addition, 90 % of the images were allocated for training, and the remaining 10 % were set aside for new and unseen data accuracy testing. To enhance the accessibility of their proposed system, Additionally, the authors developed and integrated an Android application to serve as an extra interface for their work. The achieved accuracy of up to 81,75 % serves as an encouraging outcome, indicating the effectiveness of the system's performance.
In their research, Gangatharan et al.(13) proposed an innovative approach for the automated classification of skin cancers, specifically Actinic Keratosis, Basal Cell Carcinoma, Dermatofibroma, and Melanoma, utilizing deep learning techniques and the ISIC dataset images. During the training stage, they employed both the Adam and SGD optimizers. Impressively, the model that they developed achieved the highest accuracy of 98,4 % and a loss of 7,7 % after training for 500 epochs. Subsequently, the model was integrated into a Python extension named Streamlit, which serves as an interface for users. This application accepts test images as input, utilizes the model to make predictions, and then provides the corresponding image class. The results of this approach highlight its potential for highly accurate and efficient skin cancer classification.
Albawi et al.(14) developed and deployed a neural network-based approach for predicting skin cancer. Their primary challenge revolved around the optimization of the Convolutional Neural Network (CNN) architecture and the determination of appropriate values for various CNN parameters. Their findings revealed that CNN yielded a significantly high accuracy rate compared to other existing methods, with an impressive accuracy rate of 98,5 %.
Kahia et al.(15) created a model by modifying the VGG16 and InceptionV3 architectures. They utilized a dataset comprising three classes: melanoma, nevus, and seborrheic keratosis, with 2000 images for training, 150 for validation, and 600 for testing. The experimental results demonstrated the effectiveness of their proposed approach, particularly the modified VGG16, which achieved an accuracy rate of 73,33 %. This finding suggests that their model is a promising tool for classifying skin lesions within these specific categories.
Xinrong Lu et al.(16) presented an automated method for diagnosing skin cancer based on dermoscopy images sourced from the HAM10000 dataset. Their approach classifies these images into three categories: normal, carcinoma, and melanoma. The model that they proposed is built upon an improved version of XceptionNet, integrating the swish activation function and depth-wise separable convolutions. The proposed Xception model achieved outstanding performance metrics, including Accuracy of 100 %, sensitivity of 94,05 %, Precision of 97,07 %, and F1-score of 95,53 %
Xikun Wang(17) proposed a combination of various models, including CNN, GANs, KNN, and SVM, and evaluated their performances using datasets obtained from ISIC. The primary objective of this implementation was to categorize skin lesion images into benign and malignant categories. The results of the study indicate that deep learning methods, specifically CNN and GANs, exhibit significantly higher accuracy when compared to the KNN and SVM models. CNN achieved an impressive accuracy rate of approximately 0,92 in the classification of benign and malignant skin lesions. The precision, recall, and F1 score also hovered around 0,92. GANs demonstrated relatively high accuracy levels, ranging from 0,85 to 0,9 in most cases. Meanwhile, the KNN model's accuracy fell within the range of 0,7 to 0,8, and the SVM model yielded a general accuracy of approximately 0,82.
MATERIALS AND METHODS
A. Data set
For this study, the ISIC (International Skin Image Collaboration) archive dataset was chosen as the source of data, encompassing various types of skin cancer. From this dataset, we selected benign and malignant types, comprising 1800 benign images (with 1440 designated for training and 360 for testing) and 1497 malignant images (consisting of 1197 for training and 300 for testing). This distribution of data is visually represented in figure 1. To work with these images, they were resized to (224x224x3) RGB, loaded, and transformed into NumPy arrays. As the images themselves did not come with pre-existing labels, it was necessary to create these labels, as illustrated in figure 2. Finally, these labeled images were added to a large training set, where they were thoroughly mixed for further analysis and experimentation.
B. Preprocessing
Before building and training our model, a crucial preprocessing step involved:
1) Resizing images: in the dataset to a uniform size of (224, 224, and 3) pixels. Subsequently, we partitioned the original dataset, with approximately 80 % allocated to the training dataset, and the remaining 20 % reserved for the testing set. This division allowed us to effectively train and evaluate the performance of our deep convolutional neural network.
2) Normalization of dataset: Normalization of a dataset is a critical preprocessing step in machine learning and data analysis. It involves transforming the data so that its values fall within a specific range or distribution. Normalization is typically performed to ensure that all images have a consistent scale, which can improve the performance of our model. There
are different methods for normalizing data, such as min-max normalization, z-score normalization, and decimal scaling normalization. In our study, we normalized the dataset by dividing it by 255, corresponding to an image's grayscale value.
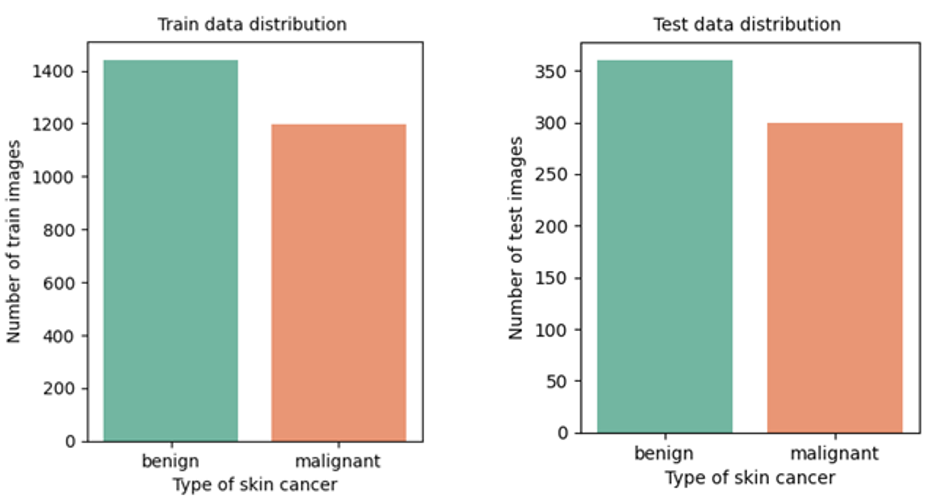
Figure 1. Distribution of training and testing data
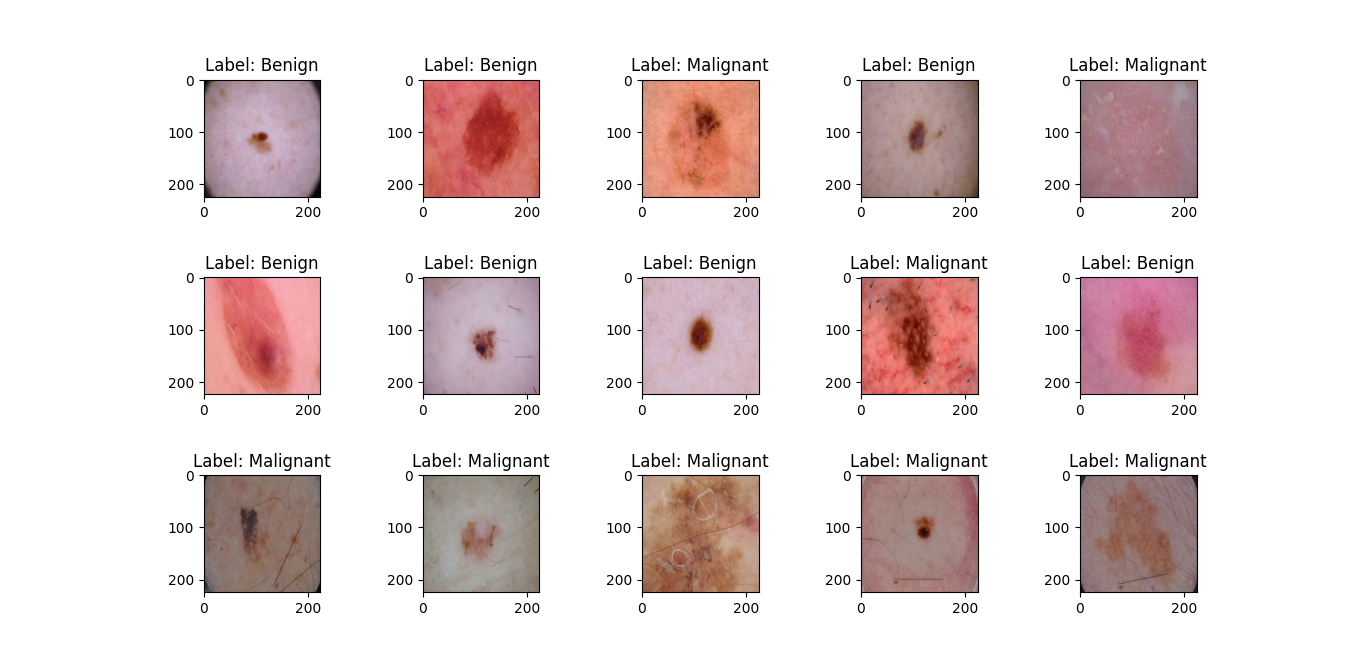
Figure 2. Labels of images
3) Augmentation of dataset: Data augmentation
played a pivotal role in enhancing the size and diversity of our dataset, resulting in improved model performance and robustness. Our approach incorporated a blend of techniques, notably color modifications and affine image transformations. These transformations encompassed a range of operations such as shear, zoom, rotation, and horizontal flips, representing a widely employed and effective modern strategy for data augmentation. By applying these transformations, we ensured that our model could learn from a broader spectrum of data, thereby generalizing its predictions accurately. The image augmentation settings utilized in our experiment are detailed in table 1.
The method being suggested is depicted in figure 3.
|
Table 1. Augmentation setting |
||
|
Augmentation setting |
Range |
|
|
Shear range |
0,2 |
|
|
Zoom range |
0,2 |
|
|
Width shift range |
0,2 |
|
|
Height shift range |
0,2 |
|
|
Rotation range |
40 |
|
|
Horizontal flip |
True |
|
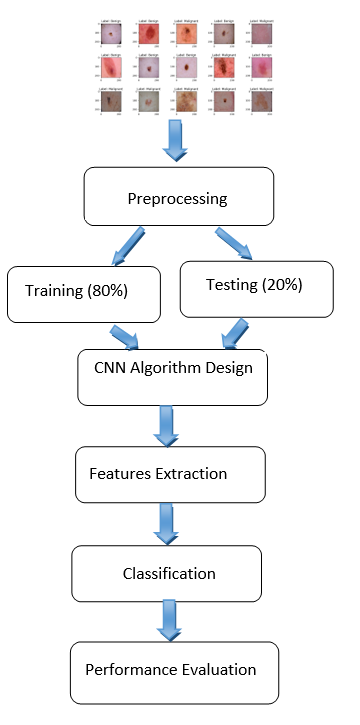
Figure 3. Flowchart of the proposed method
C. Proposed convolutional neural network model.
The CNN model was designed to analyze images categorized as "benign" or "malignant," with these categories determined by analyzing markers extracted from the image metadata. The dataset encompassed a combination of both cancer and non-cancer images.
Our model is structured with three essential layers, each serving a distinct purpose:
a) Convolution Layer: This layer is a fundamental building block that scans the input image using filters or kernels through convolution operations. It examines the image based on its dimensions and can be adjusted by altering the filter size and stride to achieve the desired output, known as a feature map or activation map as illustrated in figure 4.(18) In our model, we utilized 2D convolution with a 3x3 kernel and 64 filters. This operation plays a pivotal role in identifying relevant image features.
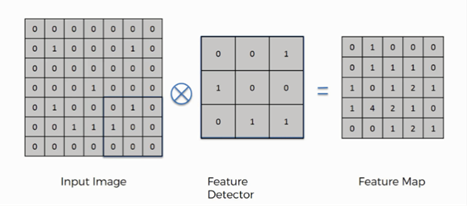
Figure 4. Example of convolution operation.(18)
b) Pooling Layer: Typically applied after a convolutional layer, the pooling layer performs down-sampling, reducing the dimensionality of the feature maps. Popular pooling methods include max pooling and average pooling, where the maximum and average values are taken, respectively. In our model, we employed MaxPooling2D with a 2x2 kernel to calculate the maximum value for each patch on the feature map, effectively reducing the spatial resolution while retaining key features. Figure 5(19) shows an example of a Max-pooling operation.
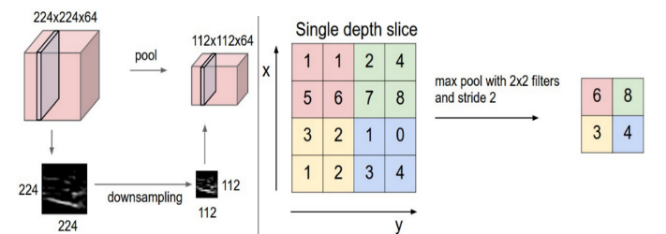
Figure 5. Example of Max-pooling operation.(19)
c) Fully Connected Layer:Situated at the end of the CNN architecture, this layer operates on an input that has been previously flattened, where each input is connected to all neurons in this layer. During this step, all neurons in the input layer are converted into one-dimensional data through flattening, followed by the use of the softmax activation function. A fully connected layer takes the inputs from previous layers and generates a vector with N dimensions, where N corresponds to the number of distinct classes to be classified. This operation is depicted in figure 6.(20)

Figure 6. Example of flattening operation.(20)
These three layers collaborate to extract and process pertinent features from the input images, reduce their dimensionality, and, in the end, make precise classifications based on the acquired patterns.
To facilitate error minimization during the training process, we used The Rectified Linear Unit (ReLU) activation function which operates by reducing the activation level of neurons, specifically by setting all negative inputs to 0, as indicated in Formula 1. Additionally, the function stipulates that when input values exceed 0, represented as 'x' in the formula, it will retain and return this positive value, 'x,' essentially allowing positive inputs to pass through unchanged.
f(x) = 0 for x < 0
f(x) = x for x ≥ 0 (1)
The drop-out layer can help to prevent overfitting during training. It works by randomly "dropping out" a specified fraction of neurons from the neural network during each training epochs. This means that the selected neurons do not participate in the forward or backward pass during this epoch.
All the layers mentioned above, have been built using the sequential model of the Convolutional Neural Network (CNN) architecture.
To achieve the binary classification needed for our context, class 0 corresponds to benign images, while class 1 is assigned to malignant images. The implementation of our system leverages a convolutional neural network, as illustrated in figure 7. In figure 8, A model summary is generated, providing details of the layers and the number of associated parameters.
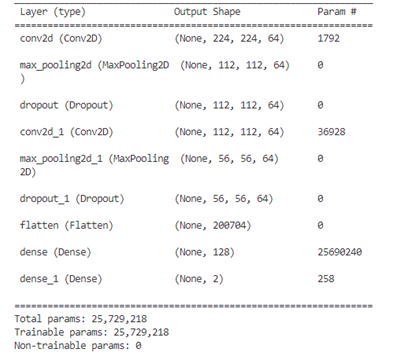
Figure 8. Summary of the model’s layers
D. Training and testing
To implement our CNN model, we utilized Keras, which is a deep-learning API for Python,(21) all methods were implemented using Keras. In this study, a dataset that contains 2637 training images and 660 test images was used.
During the training process of our model, we systematically evaluated and tested various hyperparameters to determine the combination that would yield a high-performance model. This process involved experimenting with different settings and configurations to fine-tune our model's behavior and optimize its ability to make accurate predictions.
We aimed to achieve the best possible model performance for our task and dataset by selecting the most effective hyperparameters. The various settings used during the model training and optimization process are detailed in table 2.
In our scenario, when using a limited number of epochs, the model might not have sufficient training to fully learn the underlying patterns which could result in underfitting. On the other hand, if we train the model for a large number of epochs, it may lead to overfitting, where the model starts learning not just the meaningful patterns but also the noise in the data.
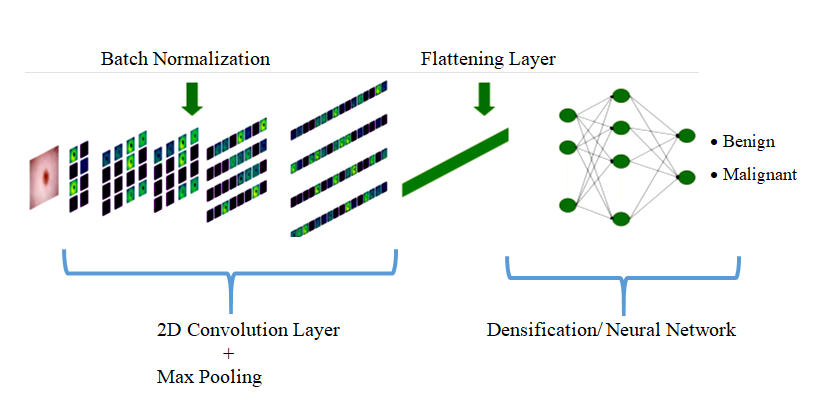
Figure 7. The architecture of the proposed CNN
Striking the right balance in the number of epochs is crucial to achieve optimal model performance. Training the model for 50 epochs enables multiple passes through the entire dataset, enhancing the potential for knowledge acquisition from a diverse set of samples and potentially leading to convergence toward an optimal solution.
The Batch Size determines the number of training samples processed in each iteration during training, its value can significantly impact the training process and the resulting model's performance.
|
Table 2. Model training parameters |
|
|
Parameter |
Value |
|
Epochs |
50 |
|
Batch size |
32 |
|
Optimizer |
Adam, RMSProp, SGD |
|
Activation function |
Softmax |
|
Learning rate |
0,0001 |
|
Drop out |
0,1 |
|
Verbose |
2 |
|
Callbacks |
ReduceLROnPlateau |
Adam,(22) RMSprop,(23) and SGD,(24) three distinct optimizers, are employed to evaluate and visualize their impacts on the model's performance.
The Softmax activation function(25) is highly favored for its simplicity and computational efficiency. It is used in the output layer of a neural network for classification. It takes an input vector and transforms it into a probability distribution over different classes. The dropout layer is primarily used to prevent overfitting.
The callback ReduceLROnPlateau(26) is used to dynamically adjust the learning rate during training based on specific conditions. The main purpose of this callback is to improve training stability and convergence.
E. Metrics for Evaluating Performance
The study utilized accuracy, precision, recall, and the F1-score metrics to evaluate the efficacy of the models employed in this research. These metrics can be computed using the following formulas:
Accuracy =(TP+TN)/(TP+FP+TN+FN) (2)
Recall/Sensitivity=TP/(TP+FN) (3)
Precision=TP/(TP+FP) (4)
F-Score= (2* Precision* Recall)/(Precision+ Recall ) (5)
Where:
· TP (True Positives): These represent cases where the model correctly predicted the positive class and the actual class was indeed positive. In other words, the model correctly identified positive cases.
· FN (False Negatives): These occur when the model predicts the negative class, but the actual class is positive. Essentially, the model fails to detect a positive case, leading to an incorrect prediction.
· FP (False Positives): In these situations, the model predicts the positive class, but the actual class is negative. This means that the model incorrectly labels a negative case as a positive.
RESULTS AND DISCUSSION
In this study, we employed a dataset comprising a total of 2,637 training images, of which 1,440 are benign and 1,197 are malignant. Additionally, we used 660 test images, with 360 being benign and 300 malignant. These images were sourced from the International Skin Imaging Collaboration (ISIC) archive. The Adam, RMSProp, and SGD optimizers were used for training, employing a learning rate of 0,0001 and a total of 50 epochs in the training process. The performances of the suggested CNN model are detailed below.(27)
A. Accuracy and loss of CNN model
Throughout the training process of our proposed model, we observed a consistent decrease in the loss function for both the training and validation datasets as the number of epochs increased. At the same time, we observed a steady increase in both training and validation accuracy, indicating an improvement in the model's performance over time. When comparing the accuracy and loss values of the three optimizers used, it becomes evident that Adam is a more suitable choice than RMSprop and SGD for our binary skin disease classification. At epoch 50, using the Adam optimizer, both training and validation accuracy were 90 % and 84 %, respectively. However, the training and validation loss were 22 % and 34 %, respectively. The overall network accuracy and loss were 84 % and 32 %, respectively. Conversely, the model employing the RMSprop optimizer achieved its highest training accuracy of 85 % by the 50th epoch and its peak validation accuracy of 79 % by the 5th epoch. Subsequently, the validation accuracy began to decrease, settling at 63 %, indicating overfitting of the model. Likewise, the model's training loss reached its highest point at 30 %, while the validation loss stabilized at 50 % around the 35th epoch. The model using the RMSprop optimizer achieved an overall accuracy of 68 %, with a loss of 47 %. Regarding the SGD optimizer, it demonstrates an overall accuracy of 71 % and a loss of 59 % with no signs of network overfitting. Results are illustrated in figures 9 and 10.(28,29)
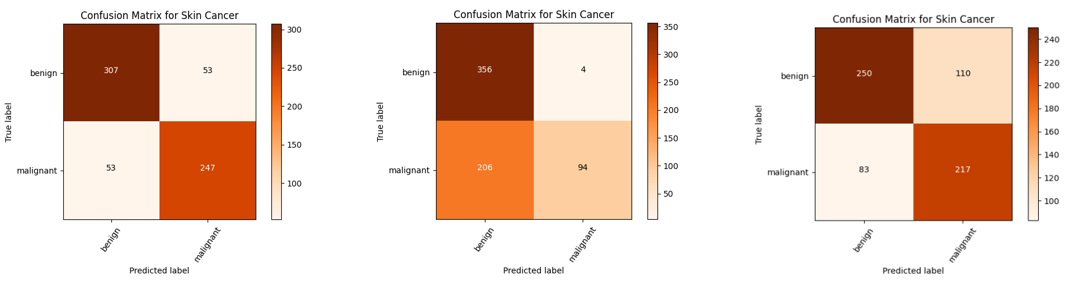
B. Confusion matrix
A confusion matrix is a tabular representation of the performance of a classification model. It shows the number of correct and incorrect predictions made by the model, broken down by class.
· Using the Adam optimizer: 307 benign test images are correctly predicted, and 53 malignant images are incorrectly predicted as benign. Another 247 malignant images are accurately predicted, and 53 malignant images are incorrectly classified as benign.
· Using the RMSProp optimizer: Out of a total of 360 benign images, 356 images are correctly predicted, while 4 images are incorrectly classified as malignant. On the other hand, among a total of 300 malignant images, 94 images are accurately predicted, but 206 images are mistakenly classified as benign.
· Using the SGD optimizer: from a total of 360 benign images, 250 were accurately identified, whereas 110 were misclassified as malignant. Conversely, of the 300 malignant images, 217 were correctly predicted, while 83 were erroneously labeled as benign.
The model confusion matrices using the three different optimizers are shown in figure 11.
C. Recall, Precision and F1-score
· Recall is a metric that measures the ability of a model to correctly identify all relevant instances of a particular class. It is also known as "sensitivity" or "true positive rate”. A high recall indicates that the model is effective at not missing positive cases, while a low recall suggests that many positive cases are being missed.
· Precision assesses the model's ability to make positive predictions and how many of them are accurate. A high precision indicates that the model is good at avoiding false positive errors, meaning that when it predicts a positive class, it's usually correct. A low precision suggests that there are many false positive predictions.
· F1-score combines both precision and recall into a single value to provide a balanced measure of a model's performance, especially in situations where imbalanced class distribution is a concern.
The values of these metrics for each optimizer are presented in table 3.(30)
D. ROC Curve
The Receiver Operating Characteristic (ROC) curve is a graphical representation used to evaluate the performance of a classification model. It plots the true positive rate (sensitivity or recall) against the false positive rate at various threshold settings.
Figure 12 displays the ROC-AUC curves for all the techniques implemented. It's evident that the proposed model with the Adam optimizer outperforms the RMSprop and SGD optimizers, achieving an AUC of 0,83 compared to the RMSprop's AUC of 0,65 and SGD’s AUC of 0,70.
E. Predictions on the test data
The results of predicted classes with actual classes are shown in figures 13,14 and 15. It's evident that the RMSprop optimizer has a stronger performance in classifying benign images compared to malignant ones, in contrast to the Adam optimizer, which shows a more balanced prediction across both classes. on the other hand, the SGD optimizer predicts malignant images better than benign ones.
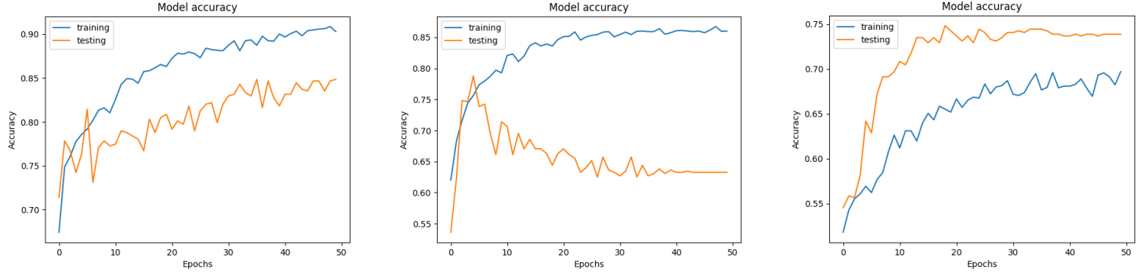
Figure 9. Accuracy curves of optimizer Adam (a), RMSProp (b), SGD (c)
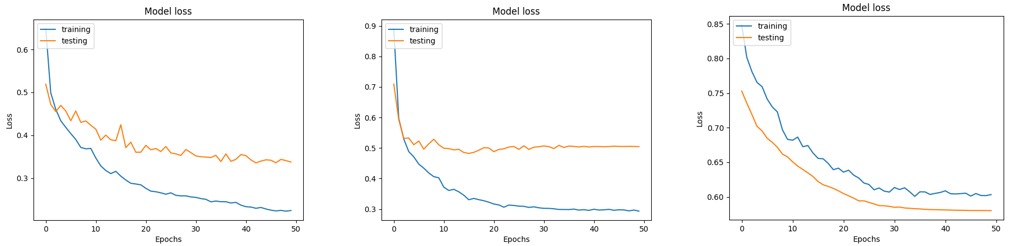
Figure 10. Loss curves of the model with optimizers Adam (a), RMSProp (b), SGD (c)
(A) (B) (C)
Figure 11. Confusion matrix of the model with optimizers Adam (a), RMSProp (b), SGD (c)
|
Table 3. Metrics results |
||||||
|
Optimizer |
Class |
Precision |
Recall |
F1-score |
Accuracy |
No of images |
|
Adam |
Benign |
0,85 |
0,85 |
0,85 |
84 % |
360 |
|
Malignant |
0,82 |
0,82 |
0,82 |
300 |
||
|
RMSProp |
Benign |
0,63 |
0,99 |
0,77 |
68 % |
360 |
|
Malignant |
0,96 |
0,31 |
0,74 |
300 |
||
|
SGD |
Benign |
0,75 |
0,69 |
0,72 |
71 % |
360 |
|
Malignant |
0,66 |
0,72 |
0,69 |
300 |
||
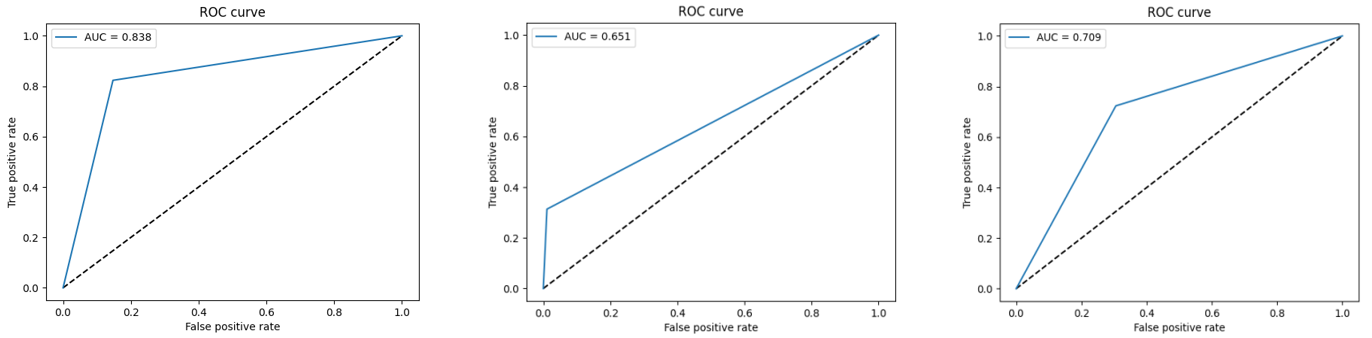
Figure 12. ROC-AUC curves of the model with optimizers Adam (a), RMSProp (b), SGD (c)
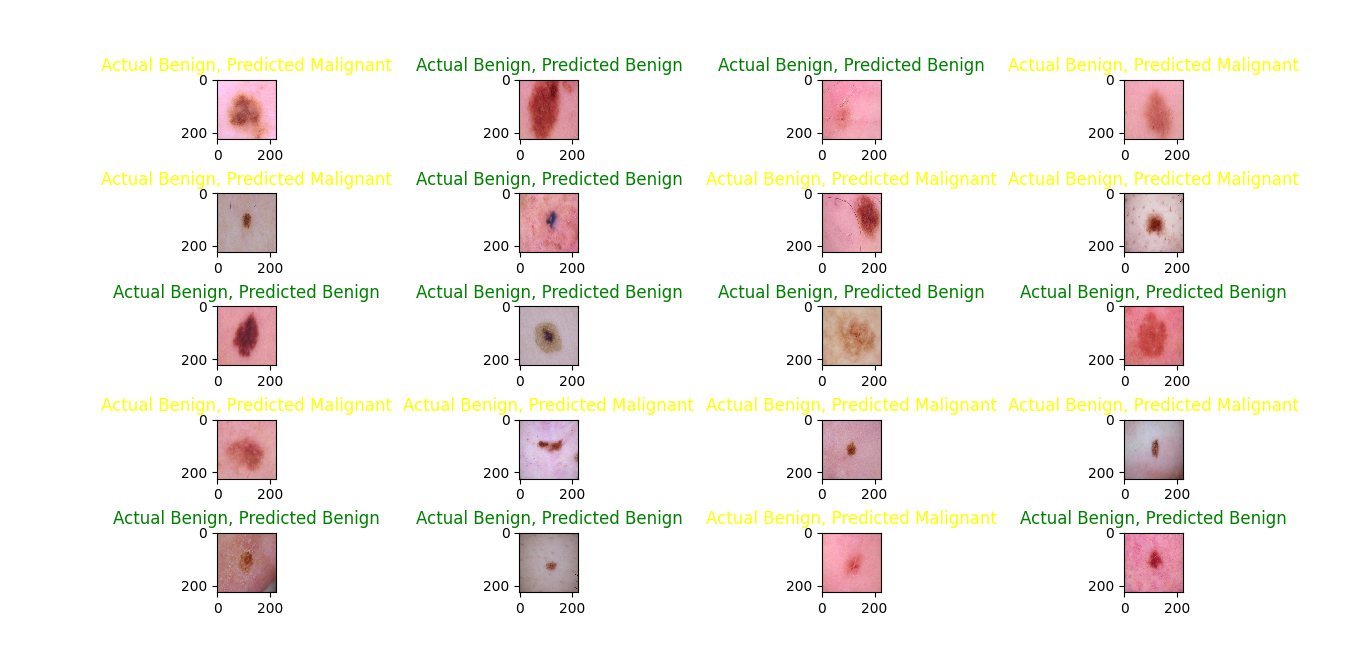
Figure 13. Prediction on test data with the Adam optimizer
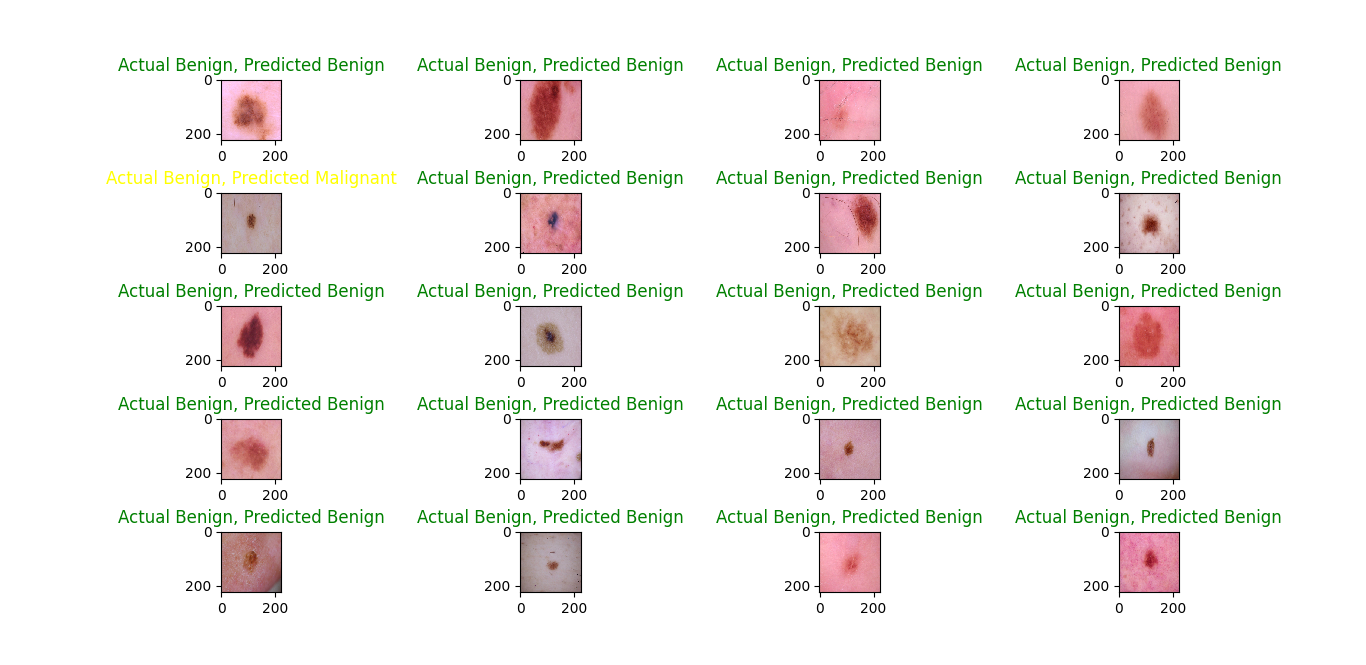
Figure 14. Prediction on test data with the RMSProp optimizer
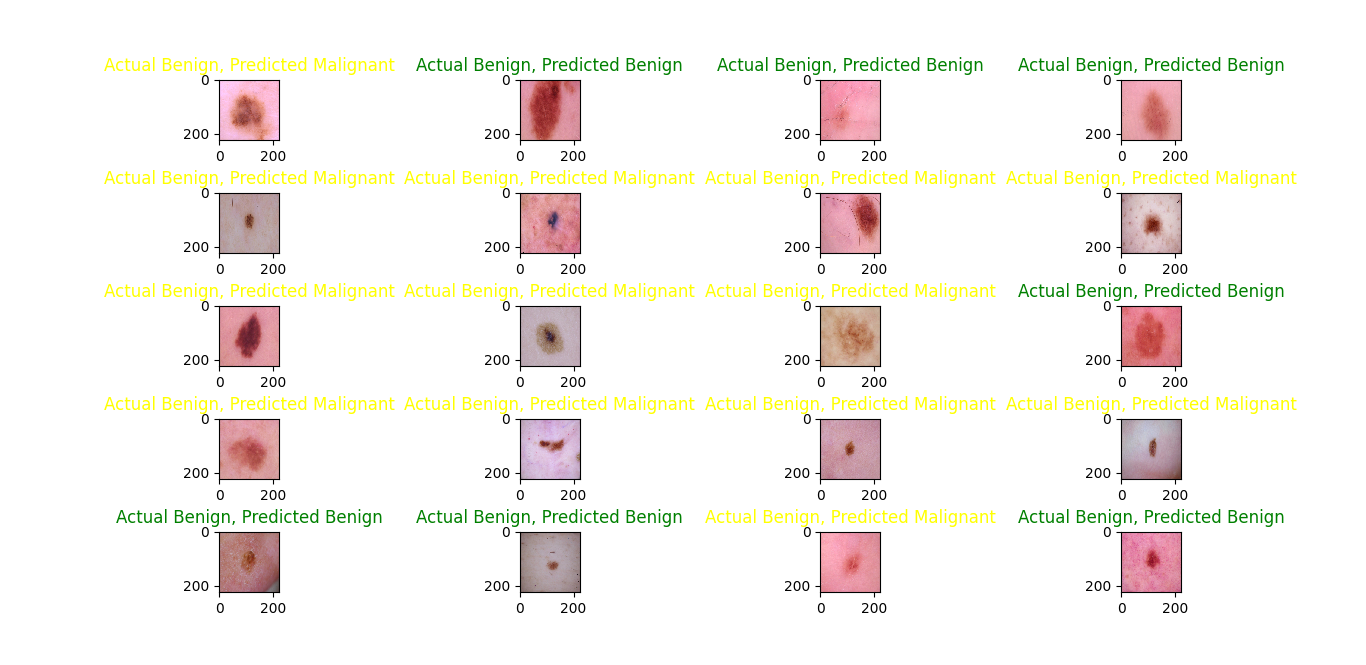
Figure 15. Prediction on test data with the SGD optimizer
CONCLUSION
Skin cancer is indeed a prevalent form of cancer, and early detection is crucial for effective treatment. Machine learning (ML) has made significant contributions to dermatology, aiding in the early detection of skin cancer and improving diagnostic accuracy. The main objective in developing this efficient system is to support a real-time clinical diagnostic project focused on skin cancer diagnosis. In this study, the Custom CNN model was employed to classify skin cancer images into benign or malignant categories. This model underwent training and testing using a dataset of 3,297 skin cancer images from the International Skin Image Collaboration archive. Based on the results of the training and testing, it can be inferred that the CNN model utilizing the Adam optimizer achieved commendable performance with 84 % accuracy and a 0,32 loss rate. Additionally, we can conclude that this model exhibited higher Recall, Precision, F1-score and ROC-AUC in comparison to the model when using the optimizers RMSProp and SGD.
In future endeavors, we are considering enhancements to these models to enable them to classify multiple categories of skin cancer.
REFERENCES
1. WHO. Cancer. Available https://www.who.int/health-topics/cancer#tab=tab_1)
2. N. Chuchu, J. Dinnes, Y. Takwoingi, R.N. Matin, S.E. Bayliss, C. Davenport, J.F. Moreau, O. Bassett, K. Godfrey, C. O'Sullivan, F.M. Walter, R.Motley, J.J. Deeks, and H.C. Williams, “Teledermatology for diagnosing skin cancer in adults”. Cochrane Database of Systematic Reviews, Dec. 2018, doi:10.1002/14651858.cd013193.
3. Maglogiannis and C.N. Doukas, “Overview of Advanced Computer Vision Systems for Skin Lesions Characterization”, IEEE Transactions on Information Technology in Biomedicine, vol. 13, no. 5, pp. 721–733, Sept. 2009, doi:10.1109/titb.2009.2017529.
4. M.S. Ali, M.S. Miah, J. Haque, M.M. Rahman, and M.K. Islam, “An enhanced technique of skin cancer classification using deep convolutional neural network with transfer learning models”, Machine Learning with Applications, vol. 5, article no. 100036, Sept. 2021, doi: 10.1016/j.mlwa.2021.100036.
5. « ISIC | International Skin Imaging Collaboration », ISIC. Consulté le: 23 octobre 2023. [En ligne]. Disponible sur: https://www.isic-archive.com
6. K. Mandal, P. K. D. Sarma, and S. Dehuri, “Image-based Skin Disease Detection and Classification through Bioinspired Machine Learning Approaches”. International Journal on Recent and Innovation Trends in Computing and Communication, vol. 12, no. 1, Sept. 2023, pp. 85–94, doi:10.17762/ijritcc.v12i1.7914.
7. R.O. Ogundokun, A. Li, R.S. Babatunde, C. Umezuruike, P.O. Sadiku, A.T. Abdulahi, and A.N. Babatunde, “Enhancing Skin Cancer Detection and Classification in Dermoscopic Images through Concatenated MobileNetV2 and Xception Models”. Bioengineering, vol. 10, no. 8, article no. 979, Aug. 2023, doi: 10.3390/ bioengineering10080979.
8. N. Nigar, A. Wajid, S. Islam, and M.K. Shahzad, “SKIN CANCER CLASSIFICATION: A DEEP LEARNING APPROACH ”, Pak. J. Sci., vol. 75, no. 02, article no. 02, juill. 2023, doi: 10.57041/pjs.v75i02.851.
9. J. S M, M. P, C. Aravindan, and R. Appavu, “Classification of skin cancer from dermoscopic images using deep neural network architectures”, Multimedia Tools and Applications, vol. 82, no 10, pp. 15763‑15778, 2023, doi: 10.1007/s11042-022-13847-3.
10. Hameed, M. Umer, U. Hafeez, H. Mustafa, A. Sohaib, M. Abubakar Siddique and H. Ahmad Madni, “Skin lesion classification in dermoscopic images using stacked convolutional neural network,” Journal of Ambient Intelligence and Humanized Computing, vol. 14, no. 4, pp. 3551–3565, Apr. 2023, doi: 10.1007/s12652-021-03485-2.
11. F. Bozkurt, “Skin lesion classification on dermatoscopic images using effective data augmentation and pre-trained deep learning approach”, Multimedia Tools and Applications, vol. 82, pp. 8985–19003, Nov. 2022, doi: 10.1007/s11042-022-14095-1.
12. R. Saifan and F. Jubair, “Six skin diseases classification using deep convolutional neural network”, Int. J. Electr. Comput. Eng. IJECE, vol. 12, no 3, article no. 3, juin 2022, pp. 3072-3082, doi: 10.11591/ijece.v12i3.pp3072-3082.
13. G. N, M. S, R. R, S. V, S. R. K. V, and S. K. B, “Enhancing Skin Cancer Diagnosis with Deep Learning-Based Classification”, Int. J. Recent Innov. Trends Comput. Commun, vol. 11, no 5s, pp. 105-111, Mai. 2023, doi: 10.17762/ijritcc.v11i5s.6634.
14. S. Albawi, M. H. Arif, and J. Waleed, “Skin cancer classification dermatologist-level based on deep learning model”, Acta Scientiarum. Technology, vol. 45, pp. e61531‑e61531, 2023, doi: 10.4025/actascitechnol.v45i1.61531.
15. Kahia, A. Echtioui, F. Kallel, and A. Ben Hamida, “Skin Cancer Classification using Deep Learning Models”, Proc. The 14th International Conference on Agents and Artificial Intelligence, Vienna, Austria: SCITEPRESS - Science and Technology Publications, 2022, pp. 554‑559. doi: 10.5220/0010976400003116.
16. X. Lu et F. Abolhasani Zadeh, “Deep Learning-Based Classification for Melanoma Detection Using XceptionNet”, J. Healthc. Eng., vol. 2022, article no .2196096, Mars 2022, doi: 10.1155/2022/2196096.
17. Auza-Santiváñez JC, Díaz JAC, Cruz OAV, Robles-Nina SM, Escalante CS, Huanca BA. Bibliometric Analysis of the Worldwide Scholarly Output on Artificial Intelligence in Scopus. Gamification and Augmented Reality 2023;1:11–11. https://doi.org/10.56294/gr202311.
18. Castillo JIR. Aumented reality im surgery: improving precision and reducing ridk. Gamification and Augmented Reality 2023;1:15–15. https://doi.org/10.56294/gr202315.
19. Castillo-Gonzalez W, Lepez CO, Bonardi MC. Augmented reality and environmental education: strategy for greater awareness. Gamification and Augmented Reality 2023;1:10–10. https://doi.org/10.56294/gr202310.
20. Aveiro-Róbalo TR, Pérez-Del-Vallín V. Gamification for well-being: applications for health and fitness. Gamification and Augmented Reality 2023;1:16–16. https://doi.org/10.56294/gr202316.
21. X. Wang, “Deep Learning-based and Machine Learning-based Application in Skin Cancer Image Classification”, J. Phys. Conf. Ser., vol. 2405, article no. 012024, Déc. 2022, doi: 10.1088/1742-6596/2405/1/012024.
22. Convolutional Neural Networks (CNN): Step 1- Convolution Operation - Blogs - SuperDataScience | Machine Learning | AI | Data Science Career | Analytics | Success ». Disponible sur: https://www.superdatascience.com/blogs/convolutional-neural-networks-cnn-step-1-convolution-operation
23. Joel, « When is max pooling exactly applied in convolutional neural networks? », Artificial Intelligence Stack Exchange. Disponible sur: https://ai.stackexchange.com/q/17857.
24. Convolutional Neural Network Tutorial [Update] », Simplilearn.com. Disponible sur: https://www.simplilearn.com/tutorials/deep-learning-tutorial/convolutional-neural-network.
25. Keras, « Keras ». Disponible sur: https://keras.io/.
26. Adam, « Adam ». Disponible sur: https://keras.io/api/optimizers/adam.
27. K. Team, « Keras documentation: RMSprop ». Disponible sur: https://keras.io/api/optimizers/rmsprop/
28. K. Team, « Keras documentation: SGD ». Disponible sur: https://keras.io/api/optimizers/sgd/.
29. « Softmax Activation Function: Everything You Need to Know | Pinecone ». Disponible sur: https://www.pinecone.io/learn/softmax-activation/
30. K. Team, « Keras documentation: ReduceLROnPlateau ». Disponible sur: https://keras.io/api/callbacks/reduce_lr_on_plateau/.
FINANCING
The authors did not receive financing for the development of this research.
CONFLICT OF INTEREST
The authors declare that there is no conflict of interest.
AUTHORSHIP CONTRIBUTION
Conceptualization: Mariame Oumoulylte, Ali Omari Alaoui, Yousef Farhaoui, Ahmad El Allaoui, Abdelkhalak Bahri.
Research: Mariame Oumoulylte, Ali Omari Alaoui, Yousef Farhaoui, Ahmad El Allaoui, Abdelkhalak Bahri.
Drafting - original draft: Mariame Oumoulylte, Ali Omari Alaoui, Yousef Farhaoui, Ahmad El Allaoui, Abdelkhalak Bahri.
Writing - proofreading and editing: Mariame Oumoulylte, Ali Omari Alaoui, Yousef Farhaoui, Ahmad El Allaoui, Abdelkhalak Bahri.