doi: 10.56294/dm2023125
Design of a Risk Scoring System for Post Surgical Adverse Events on Neuro-oncological patients
Diseño de un Sistema de Cálculo de Riesgo para Eventos Adversos Postoperatorios en Pacientes Neuro-oncológicos
Rodrigo Lagos1, Matías Espinoza2*, Alejandro Cubillos3
1Clinical Epidemiology Research, Department of Cancer Research, Instituto Oncológico Fundación Arturo López-Pérez
2Medical Informatics and Data Science, Department of Cancer Research, Instituto Oncológico Fundación Arturo López-Pérez
3Neurosurgery, Surgical Oncology, Instituto Oncológico Fundación Arturo López-Pérez
Cite as: Lagos R, Espinoza M, Cubillos A. Design of a Risk Scoring System for Post Surgical Adverse Events on Neuro-oncological patients. Data and Metadata 2023; 2:125. https://doi.org/10.56294/dm2023125.
Submitted: 26-09-2023 Revised: 31-10-2023 Accepted: 11-12-2023 Published: 12-12-2023
Editor: Prof.
Dr. Javier González Argote ![]()
ABSTRACT
This paper aims to validate and subsequently design a Risk Scoring System based on Lohman et al.(14) risk calculator for patients undergoing brain or spinal tumor surgery. Three models were tested: replication of Lohman’s methodology, modification of risk groups, and development of a custom risk calculator. The replication of Lohman’s instrument did not show significant correlations with adverse events in the study population. However, the adapted risk calculator demonstrated promising predictive performance for unplanned reoperation at 30 days, indicating good utility. The study suggests the potential applicability of the adapted risk calculator for predicting unplanned reoperation within 30 days for patients undergoing brain or spinal tumor surgery. Further research with larger samples and less missing data is recommended to confirm and enhance the utility of the proposed risk calculator. The results could be used to optimize decision-making and improve the quality of care for neuro-oncological surgery patients.
Keywords: Risk Scoring System; Neuro-Oncology; Post-Surgical Adverse Events.
RESUMEN
El objetivo de este trabajo es validar y, posteriormente, diseñar un sistema de puntuación de riesgos basado en la calculadora de riesgos de Lohman et al.(14) para pacientes sometidos a cirugía de tumores cerebrales o medulares. Se probaron tres modelos: replicación de la metodología de Lohman, modificación de los grupos de riesgo y desarrollo de una calculadora de riesgo personalizada. La replicación del instrumento de Lohman no mostró correlaciones significativas con los acontecimientos adversos en la población del estudio. Sin embargo, la calculadora de riesgos adaptada demostró un rendimiento predictivo prometedor para la reoperación no planificada a 30 días, lo que indica una buena utilidad. El estudio sugiere la aplicabilidad potencial de la calculadora de riesgo adaptada para predecir la reoperación no planificada a los 30 días en pacientes sometidos a cirugía de tumores cerebrales o espinales. Se recomienda seguir investigando con muestras más grandes y menos datos perdidos para confirmar y mejorar la utilidad de la calculadora de riesgo propuesta. Los resultados podrían utilizarse para optimizar la toma de decisiones y mejorar la calidad asistencial de los pacientes sometidos a cirugía neurooncológica.
Palabras clave: Sistema de Puntuación de Riesgo; Neuro-Oncología; Eventos Adversos Postquirúrgicos
INTRODUCTION
Currently, having instruments that allow predicting the risk of postoperative adverse events in major surgeries, especially in neuro-oncological surgery, seems crucial due to the interest of health insurances in focusing on clinical outcomes and the constant challenge of improving quality.(1,2,3,4,5,6) Preoperative categorization of the risk profile of patients in neuro-oncological surgery enables valid comparisons between centers in terms of frequency and type of postoperative adverse events. It also optimizes therapeutic decision-making by adapting them to the specific risk of each case and improves the quality of preoperative informed consent.
Various risk calculators for complications and adverse events have been proposed in neuro-oncological surgery, mostly based on large case registries and the application of logistic regression models.(7,8,9,10,11) These calculators associate different preoperative independent variables with the probability of specific adverse events occurring postoperatively. However, they have not yet been sufficiently validated to recommend their universal use. Lohman et al.(14) developed a specific risk calculator for brain and spinal tumor surgeries in adults. Through a prospective study, they included 1,000 patients undergoing surgery for brain or spinal tumors (benign or malignant) between September 2017 and May 2019. The sample was divided into two groups: a development group with 700 cases, and an internal validation group with 300 cases. Both groups shared baseline clinical-demographic characteristics. Data on admission and postoperative outcomes were extracted from semi-automated electronic clinical records, including relevant demographic, clinical, administrative, and laboratory variables for the study.(13,14) Each continuous variable was converted into categorical using the median as the cutoff value, while discontinuous variables were dichotomized. These categorizations were based on their utility for designing risk scoring instruments. The primary outcomes of the study were nosocomial infection and/or surgical site infection at 30 days, unplanned reoperation at 30 days, and "any adverse event" (nosocomial infection, reoperation, mortality, or readmission) at 30 days. By performing univariate and multivariate logistic regression analyses, relevant variables were identified, and scores were assigned to classify patients into three risk groups. The predictive model was validated using the validation group, and receiver operating characteristic (ROC) curves were constructed.
This instrument successfully predicted the probability of adverse events occurring according to the categorized risk groups and showed appropriate internal validation. These adverse events are considered relevant quality indicators in neuro-oncological surgery. The authors highlight that the instrument is easily applicable in the clinical setting due to the limited number of variables it uses.
The objective of this study is to define a predictive instrument for the risk of postoperative adverse events in adult patients with brain or spinal tumors, feasible to apply in our institution, based on the validation of Lohman's instrument.
METHODS
To address the objective of the study, the following models were tested sequentially:
• Model 1: validation of the Lohman instrument in the study population, replicating exactly the methodology reported for this instrument.
• Model 2: evaluation of an instrument based on the Lohman study, but only considering 2 risk groups for primary outcomes (high and low risk). The dichotomization was performed as follows: the high-risk group was defined based on the score assigned by the Lohman instrument for that category, while the low-risk group was defined based on the scores assigned to both the low and moderate-risk groups of the same instrument.
• Model 3: design of a custom risk calculator based on bivariate analysis of relevant independent variables found in our study population. This model was only performed when data for all significant independent variables were available in at least 70 % of the cases, which was only fulfilled for the 30-day Reoperation outcome. A model was trained to calculate a new risk score using Bayesian logistic regression with noninformative prior distributions. A training (60 %) and a testing dataset (40 %) were randomly extracted. This model, applied to the training dataset, was evaluated using the PSI-LOO method. From this beta distribution, the mean was obtained by multiplying by 10 to obtain the risk score weighted by each independent variable. The model was dichotomized into 2 risk groups, and the optimal cutoff score was defined based on the ROC curve analysis. This model was then applied to predict the risk on the testing dataset.
Patient Selection
A retrospective sample of 213 patients who underwent surgery for brain or spinal tumors at FALP between January 2019 and June 2022 was selected.
Data Collection
Data were semi-automatically extracted from structured and unstructured sources in the FALP databases. The primary source for patient identification was the surgical protocol, complemented with relevant information recorded in the electronic medical records, mainly the pre-anesthetic evaluation and medical notes. Biopsies and medical examinations results were also collected.
Statistical Analysis
Descriptive statistics were applied. To compare two groups regarding continuous variables, the Wilcoxon signed-rank test or the Kruskal-Wallis test was used as appropriate. Fisher’s exact test was used to compare groups with categorical variables, and the Cochran-Armitage test was used for ordinal variables. All analyses were conducted using R version 4.0.4.
Only patients with complete records of independent variables were considered for the application of risk score for the primary outcomes under study.
In models 2 and 3, sensitivity, specificity, accuracy, positive predictive value, and negative predictive value were calculated. Additionally, positive likelihood ratio (LD+) and negative likelihood ratio (LD-) were computed. Finally, the respective confusion matrices were constructed. A significance level of p<0,05 was considered for statistical significance.
RESULTS
Nosocomial Infection
The univariate analysis of the relationship between nosocomial infection and the variables from the original study showed significant differences in the variables "days in Intensive Care Unit (ICU)," "type of tumor," and "ECOG Performance Status" (Table 1).
|
Table 1. Association between Nosocomial Infection and Independent Variables Under Study |
||||
|
Variable |
n |
No (n = 174) |
Yes (n = 39) |
p.value |
|
Sex |
213 |
|
|
0,35304724 |
|
F |
|
99 / 174 (57 %) |
19 / 39 (49 %) |
|
|
M |
|
75 / 174 (43 %) |
20 / 39 (51 %) |
|
|
Age |
213 |
59 (16 - 88) |
62 (16 - 83) |
0,77918523 |
|
Nursing care |
156 |
|
|
0,78967418 |
|
Some |
|
68 / 126 (54 %) |
17 / 30 (57 %) |
|
|
None |
|
58 / 126 (46 %) |
13 / 30 (43 %) |
|
|
Unknown |
|
48 |
9 |
|
|
ICU Days |
213 |
0,00 (0,00 – 3,00) |
0,00 (0,00 – 16,00) |
2,55E-07 |
|
Admission |
213 |
|
|
0,44706163 |
|
Elective |
|
143 / 174 (82 %) |
30 / 39 (77 %) |
|
|
Emergency |
|
31 / 174 (18 %) |
9 / 39 (23 %) |
|
|
Protein C |
34 |
4 (0 - 23) |
2 (0 - 37) |
0,60362289 |
|
Unknown |
|
157 |
22 |
|
|
Primary or Recurrent Tumor |
213 |
|
|
0,04352517 |
|
Primary |
|
159 / 174 (91 %) |
31 / 39 (79 %) |
|
|
Recurrent |
|
15 / 174 (8,6 %) |
8 / 39 (21 %) |
|
|
Leukocytes |
156 |
7,380 (1,090 - 207,000) |
8,170 (2,900 - 322,000) |
0,07834873 |
|
Unknown |
|
55 |
2 |
|
|
ECOG PS |
176 |
|
|
0,00280002 |
|
0 |
|
52 / 145 (36 %) |
3 / 31 (9,7 %) |
|
|
1 |
|
60 / 145 (41 %) |
13 / 31 (42 %) |
|
|
2 |
|
33 / 145 (23 %) |
15 / 31 (48 %) |
|
|
Unknown |
|
29 |
8 |
|
|
Surgery Time |
213 |
167 (38 - 530) |
169 (47 - 555) |
0,95987388 |
Model 1: only patients with complete records (34 cases) were used. When dividing the risk groups into low (score = 0), medium (score between 1 and 25), and high (score greater than 25) using the Lohman instrument, no statistically significant relationship was found (p-value = 0,5459). In other words, there was no evidence of an association between the risk groups defined according to the Lohman instrument and the observed frequency of nosocomial infection.
Model 2: patients were grouped into two categories (low: less than or equal to 25 points, and high: greater than 25 points). The prediction metrics are shown in table 2, and the confusion matrix is presented in figure 1.
|
Table 2. Prediction metrics for the binarization (Model 2) |
|||
|
|
Nosocomial |
Reoperation |
Adverse Event |
|
Acuciosidad Acuity |
0,4583 (0,2555 - 0,6718) |
0,6589 (0,5703 - 0,7401) |
0,4737 (0,2445 - 0,7114) |
|
Sensitivity |
0,4286 |
0,444 |
0,400 |
|
Specificity |
0,5 |
0,693 |
0,556 |
|
Positive predictive value |
0,5455 |
0,19 |
0,500 |
|
Negative predictive value |
0,3846 |
0,885 |
0,455 |
|
LD+ |
1,4509 |
1,45 |
0,900 |
|
LD- |
0,801 |
0,8 |
1,070 |
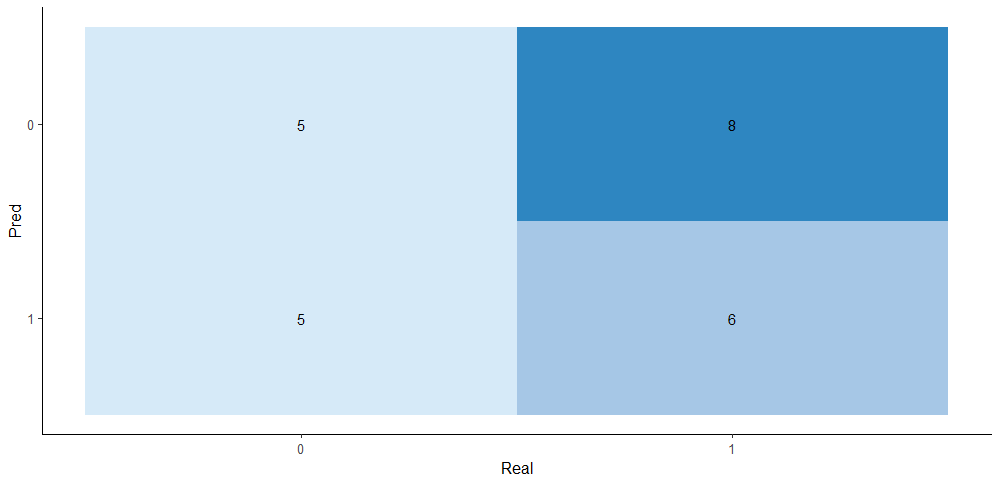
Figure 1. Confusion matrix for the binarized risk score for nosocomial infection
The binary risk groups defined show a low accuracy, as they can only correctly classify about 45,83 % of instances overall. The sensitivity is relatively low, suggesting difficulties in detecting positive cases. The specificity is low, indicating that the model is ineffective in correctly identifying negative cases.
Unplanned Reoperation
The
univariate analysis of the relationship between unplanned reoperation at 30
days and the variables from the original study showed significant differences
in the variables "days in Intensive Care Unit (ICU)," "type of
tumor," "leukocytes," and "ECOG Performance Status"
(Table 3).
|
Table 3. Association between unplanned reoperation and independent variables under study |
|||||
|
Variable |
n |
No (n = 187) |
Yes (n = 26) |
p.value |
|
|
Sex |
213 |
|
|
0,31146121 |
|
|
F |
|
106 / 187 (57 %) |
12 / 26 (46 %) |
|
|
|
M |
|
81 / 187 (43 %) |
14 / 26 (54 %) |
|
|
|
Age |
213 |
60 (16 - 88) |
62 (16 - 80) |
0,9701891 |
|
|
Nursing care |
156 |
|
|
0,31194746 |
|
|
Some |
|
72 / 136 (53 %) |
13 / 20 (65 %) |
|
|
|
None |
|
64 / 136 (47 %) |
7 / 20 (35 %) |
|
|
|
Unknown |
|
51 |
6 |
|
|
|
ICU days |
213 |
0,00 (0,00 – 10,00) |
0,00 (0,00 – 16,00) |
2,80E-06 |
* |
|
Admission |
213 |
|
|
0,59238742 |
|
|
Elective |
|
153 / 187 (82 %) |
20 / 26 (77 %) |
|
|
|
Emergency |
|
34 / 187 (18 %) |
6 / 26 (23 %) |
|
|
|
Protein C |
34 |
2 (0 - 37) |
14 (0 - 18) |
0,17123483 |
|
|
Unknown |
|
158 |
21 |
|
|
|
Primary or Recurrent Tumor |
213 |
|
|
0,00239016 |
* |
|
Primary |
|
172 / 187 (92%) |
18 / 26 (69 %) |
|
|
|
Recurrent |
|
15 / 187 (8.0%) |
8 / 26 (31 %) |
|
|
|
Leukocytes |
156 |
7,440 (1,090 - 322,000) |
10,740 (2,900 - 20,050) |
0,02248531 |
* |
|
Unknown |
|
52 |
5 |
|
|
|
ECOG PS |
176 |
|
|
0,0034342 |
* |
|
0 |
|
54 / 156 (35 %) |
1 / 20 (5,0 %) |
|
|
|
1 |
|
65 / 156 (42 %) |
8 / 20 (40 %) |
|
|
|
2 |
|
37 / 156 (24 %) |
11 / 20 (55 %) |
|
|
|
Unknown |
|
31 |
6 |
|
|
|
Surgery Time |
213 |
165 (38 - 530) |
175 (47 - 555) |
0,97967708 |
* |
Application of Risk Score in Unplanned Reoperation
To apply this risk score, a total of 129 cases were used.
Model 1: the risk groups for reoperation were defined according to the Lohman study (low: score less than 10; medium: score between 10 and 25; high: score greater than 25), and the frequency of reoperations was calculated for each group. No significant difference in the frequency of reoperations was found among the groups using the Cochran-Armitage test (p-value = 0,08826).
Model 2: the patients were grouped into two categories (low: less than or equal to 25 and high: greater than 25). These binary groups were used to calculate the performance metrics for prediction, which are shown in table 2, and their confusion matrix is presented in figure 2.
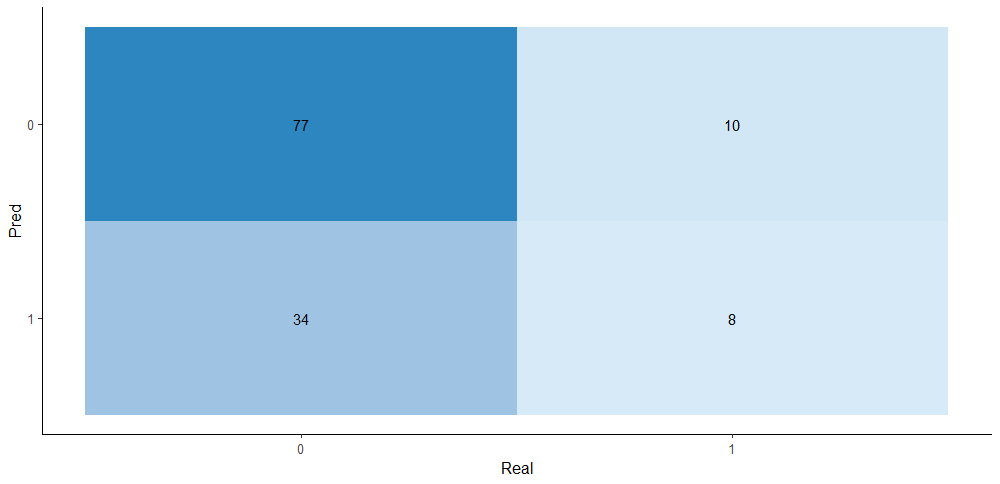
Figure 2. Confusion matrix for the binarized risk score for unplanned reoperation
It is observed that the model has a moderate accuracy, as it correctly classified only 65,89 % of the instances overall. The sensitivity is relatively high, suggesting that the model can correctly detect positive cases. However, the specificity is moderate, indicating that the risk score correctly identifies some of the negative cases.
Any Adverse Event
The univariate analysis of the relationship between Any Adverse Event and the variables from the Lohman study showed significant differences in the variables "Days in Intensive Care Unit (ICU)," "Type of Tumor," "ECOG Performance Status" and "Leukocytes." (Table 4).
|
Table 4. Association between Any Adverse Event and Independent Variables Under Study |
|||||
|
Variable |
n |
No (n = 158) |
Yes (n = 55) |
p.value |
|
|
Sex |
213 |
|
|
0,08494754 |
|
|
F |
|
93 / 158 (59 %) |
25 / 55 (45 %) |
|
|
|
M |
|
65 / 158 (41 %) |
30 / 55 (55 %) |
|
|
|
Age |
213 |
59 (16 - 88) |
62 (16 - 83) |
0,38549067 |
|
|
Nursing Care |
156 |
|
|
0,68599753 |
|
|
Some |
|
61 / 114 (54 %) |
24 / 42 (57 %) |
|
|
|
None |
|
53 / 114 (46 %) |
18 / 42 (43 %) |
|
|
|
Unknown |
|
44 |
13 |
|
|
|
ICU Days |
213 |
0,00 (0,00 – 3,00) |
0,00 (0,00 – 16,00) |
9,73E-07 |
* |
|
Admission |
213 |
|
|
0,14108879 |
|
|
Elective |
|
132 / 158 (84 %) |
41 / 55 (75 %) |
|
|
|
Emergency |
|
26 / 158 (16 %) |
14 / 55 (25 %) |
|
|
|
Protein C |
34 |
4 (0 - 23) |
2 (0 - 37) |
0,60362289 |
|
|
Unknown |
|
141 |
38 |
|
|
|
Type of Tumors |
213 |
|
|
0,00223197 |
* |
|
Primary |
|
147 / 158 (93 %) |
43 / 55 (78 %) |
|
|
|
Recurrent |
|
11 / 158 (7,0 %) |
12 / 55 (22 %) |
|
|
|
Leukocytes |
156 |
7,380 (1,090 - 207,000) |
8,340 (2,900 - 322,000) |
0,01126728 |
* |
|
Unknown |
|
50 |
7 |
|
|
|
ECOG PS |
176 |
|
|
0,00024922 |
* |
|
0 |
|
51 / 133 (38 %) |
4 / 43 (9,3 %) |
|
|
|
1 |
|
54 / 133 (41 %) |
19 / 43 (44 %) |
|
|
|
2 |
|
28 / 133 (21 %) |
20 / 43 (47 %) |
|
|
|
Unknown |
|
25 |
12 |
|
|
|
Surgery Time |
213 |
170 (38 - 530) |
160 (47 - 555) |
0,33116808 |
|
Application of Any Adverse Event Risk Score
To apply this risk score, a total of 24 cases were used.
Model 1: the risk groups for any adverse event were defined according to the Lohman study (low: score equal to 0; medium: score between 1 and 22; high: score greater than 22). The frequency of adverse events was calculated for each group, but no significant difference in the frequency of events was found among the groups using the Cochran-Armitage test (p-value = 0,09116).
Model 2: two new binary risk groups were established, one for low risk (score less than or equal to 22) and one for high risk (score greater than 22). The performance metrics for predictive analysis are shown in table 2, and their confusion matrix is presented in figure 3.
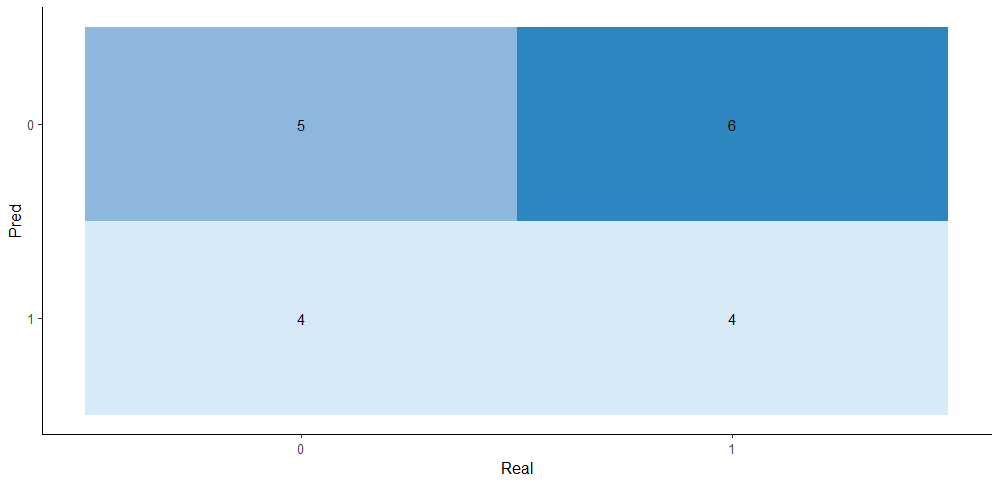
Figure 3. Confusion
matrix for the binarized risk score for any adverse event
The accuracy is low as it correctly classified only 48,37 % of the instances overall. Both sensitivity and specificity are low, suggesting difficulties in correctly identifying positive and negative cases.
Model 3 Results
The model was trained solely to predict the risk of Unplanned Reoperation at 30 days, as it was the only outcome with more than 70 % of records of values for the significant variables from the univariate analysis. The obtained scores and significant variables are shown in table 5.
|
Table 5. Weighted Risk Score for Significant Independent Variables Associated with the Risk of Unplanned Reoperation at 30 days |
||
|
Variable |
Median Beta distribution |
Score |
|
ECOG PS |
1,92 |
19 |
|
Recurrent Tumor |
1,72 |
17 |
|
ICU Days |
1,37 |
14 |
The performance metrics obtained are shown in table 6, and their confusion matrix is presented in figure 4.
|
Table 6. Predictability metrics for the binarized risk score for Unplanned Reoperation at 30 days (LD+: Positive Likelihood Ratio; LD-: Negative Likelihood Ratio) |
|
|
Acuity |
0,8824 (0,7613 - 0,9556) |
|
Sensitivity |
0,7143 |
|
Specificity |
0,9091 |
|
Positive predictive value |
0,5556 |
|
Negative predictive value |
0,9524 |
|
LD+ |
7,8571 |
|
LD- |
0,3143 |
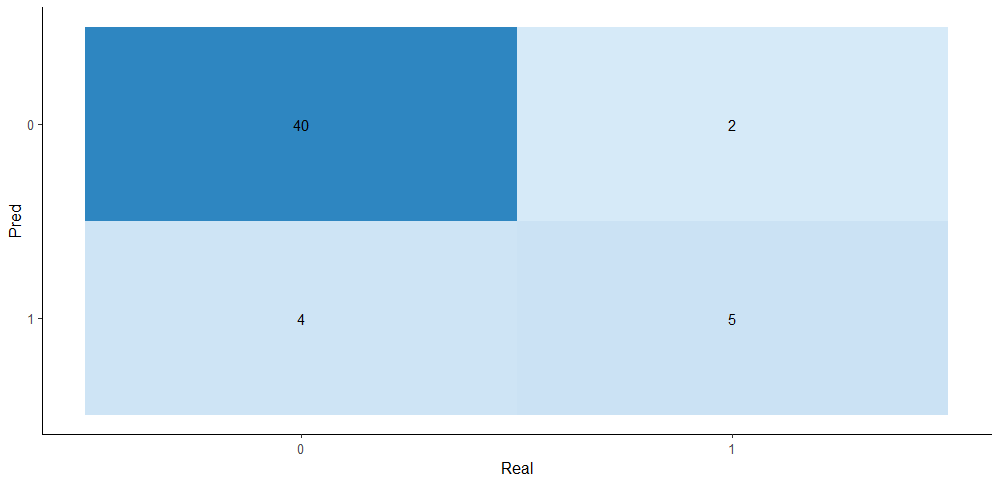
Figure 4. Confusion
matrix for the binarized risk score for Unplanned Reoperation at 30 days (Model
3)
DISCUSSION
Our results (Model 1) do not show evidence of correlation between the risk groups defined according to Lohman's calculator and the frequency of the studied adverse outcomes. When binarizing the risk groups (Model 2), the predictability metrics of the model did not yield results that validate it as an effective calculator in our case population. This could be explained by: differences in the baseline characteristics of our patients compared to the Lohman study, which we did not specifically study; a smaller overall sample size (n=213 vs. 1000 in Lohman's study) due to a lower volume of surgeries performed at our center compared to Lohman's; insufficient data for some independent variables (e.g., only 24 cases with C-reactive protein data; in our setting, this test is not routinely requested in the preoperative period). It is noteworthy that our univariate analyses did not yield exact matches with Lohman's study in identifying the variables most associated with the defined adverse outcomes, which can also be explained by the reasons mentioned above.
On the other hand, our Model 3 yielded a LD+ of 7,85, which gives the calculator a "good" utility, considering that it is several times higher than the LD+ values observed in Model 2 for Unplanned Reoperation at 30 days (LD+ of 1,45), based on the binarization of groups using Lohman's methodology. The LD- was 0,3, placing the calculator in the "fair" utility range, but still above what was observed in Model 2 (LD- of 0,800), which gives that predictive model "no" utility. LD values are key metrics used to relate the pre-test probability to the post-test probability estimation of a specific outcome. Their utility does not depend on the prevalence of that outcome, and their predictive value is even greater in dichotomous models, as in our case (Model 3).
CONCLUSIONS
The risk calculator for Unplanned Reoperation at 30 days in our patients operated on for brain and spinal tumors, developed in this study, would be feasible and useful to apply in our setting.
Furthermore, we propose conducting a future validation study of Lohman's calculator with a larger population and a lower proportion of missing data to confirm or reject the results observed in the present study for models 1 and 2.
REFERENCES
1. Dasenbrock HH, Liu KX, Devine CA, Chavakula V, Smith TR, Gormley WB, et al. Length of hospital stay after craniotomy for tumor: A National Surgical Quality Improvement Program analysis. Neurosurg Focus. 2015;39(6).
2. Schipmann S, Schwake M, Suero Molina E, Roeder N, Steudel WI, Warneke N, et al. Quality Indicators in Cranial Neurosurgery: Which Are Presently Substantiated? A Systematic Review. World Neurosurg [Internet]. 2017;104:104–12. Available from: http://dx.doi.org/10.1016/j.wneu.2017.03.
3. Schipmann S, Schwake M, Suero Molina E, Roeder N, Steudel WI, Warneke N, et al. Quality Indicators in Cranial Neurosurgery: Which Are Presently Substantiated? A Systematic Review. World Neurosurg [Internet]. 2017;104:104–12. Available from: http://dx.doi.org/10.1016/j.wneu.2017.03.1
4. Karhade A V., Vasudeva VS, Dasenbrock HH, Lu Y, Gormley WB, Groff MW, et al. Thirty-day readmission and reoperation after surgery for spinal tumors: A National Surgical Quality Improvement Program analysis. Neurosurg Focus. 2016;41(2).
5. Schoenfeld AJ, Le H V., Marjoua Y, Leonard DA, Belmont PJ, Bono CM, et al. Assessing the utility of a clinical prediction score regarding 30-day morbidity and mortality following metastatic spinal surgery: the New England Spinal Metastasis Score (NESMS). Spine J [Internet]. 2016;16(4):482–90. Available from: http://dx.doi.org/10.1016/j.spinee.2015.09.043
6. Ramesh VJ, Rao GSU, Guha A, Thennarasu K. Evaluation of POSSUM and P-POSSUM scoring systems for predicting the mortality in elective neurosurgical patients. Br J Neurosurg. 2008;22(2):275–8.
7. Kuan EC, Badran KW, Yoo F, Bhandarkar ND, Haidar YM, Tjoa T, et al. Predictors of Short-term Morbidity and Mortality in Open Anterior Skull Base Surgery. Laryngoscope. 2019 Jun 1;129(6):1407–12.
8. Reponen E, Korja M, Niemi T, Silvasti-Lundell M, Hernesniemi J, Tuominen H. Preoperative identification of neurosurgery patients with a high risk of in-hospital complications: A prospective cohort of 418 consecutive elective craniotomy patients. J Neurosurg [Internet]. 2015 Sep 1 [cited 2022 Jan 19];123(3):594–604. Available from: https://thejns.org/view/journals/j-neurosurg/123/3/article-p594.xml
9. Jimenez A, Khalafallah AM, Huq S, Pollock J. A Novel Online Calculator for Hospital Length of Stay in Brain Tumor Patients Trends in US Spinal Surgery : A 6 Year Analysis on Laminectomies Pre-operative Urinary Tract Infection Increases Post-Operative Morbidity in Spine Patients. 2020;67(1):2020.
10. Vaziri S, Wilson J, Abbatematteo J, Kubilis P, Chakraborty S, Kshitij K, et al. Predictive performance of the American College of Surgeons universal risk calculator in neurosurgical patients. J Neurosurg. 2018;128(3):942–7.
11. Gibula, D. R., Singh, A. B., Bronsert, M. R., Henderson, W. G., Battaglia, C., Hammermeister, K. E., Glebova, N. O, Meguid, R. A. Surgery (2019), 812-819, 166(5).AccuratePreoperativePrediction of Unplanned 30-Day PostoperativeReadmissionUsing 8 predictor variables.
12. Inastrilla CRA. Data Visualization in the Information Society. Seminars in Medical Writing and Education 2023;2:25–25. https://doi.org/10.56294/mw202325
13. Canova-Barrios C, Machuca-Contreras F. Interoperability standards in Health Information Systems: systematic review. Seminars in Medical Writing and Education 2022;1:7–7. https://doi.org/10.56294/mw20227
14. Lohmann S, Brix T, Varghese J, Warneke N, Schwake M, Molina ES, et al. Development and validation of prediction scores for nosocomial infections, reoperations, and adverse events in the daily clinical setting of neurosurgical patients with cerebral and spinal tumors. J Neurosurg. 2021;134(4):1226–36.
FINANCING
The authors did not receive financing for the development of this research.
CONFLICT OF INTEREST
The authors declare that there is no conflict of interest.
AUTHORSHIP CONTRIBUTION
Conceptualization: Rodrigo Lagos, Matías Espinoza, Alejandro Cubillos.
Data curation: Rodrigo Lagos, Matías Espinoza.
Formal analysis: Rodrigo Lagos.
Research: Rodrigo Lagos, Matías Espinoza, Alejandro Cubillos.
Methodology: Rodrigo Lagos, Matías Espinoza, Alejandro Cubillos.
Project management: Rodrigo Lagos, Alejandro Cubillos.
Supervision: Alejandro Cubillos.
Validation: Alejandro Cubillos.
Display: Rodrigo Lagos, Matías Espinoza, Alejandro Cubillos.
Drafting - original draft: Rodrigo Lagos, Matías Espinoza, Alejandro Cubillos.
Writing - proofreading and editing: Rodrigo Lagos, Matías Espinoza, Alejandro Cubillos.