doi: 10.56294/dm2024251
ORGINAL
Predicting saturation for a new fabric using artificial intelligence (fuzzy logic): experimental part
Predicción de la saturación de un nuevo tejido mediante inteligencia artificial (lógica difusa): parte experimental
Mhammed El Bakkali1 ![]() *, Redouane Messnaoui1 *, Mustapha Elkhaoudi1 *, Omar Cherkaoui1
*, Redouane Messnaoui1 *, Mustapha Elkhaoudi1 *, Omar Cherkaoui1 ![]() *, Aziz Soulhi2
*, Aziz Soulhi2 ![]() *
*
1Higher School of Textile and Clothing Industries. Casablanca Morocco.
2National Higher School of Mines of Rabat. Morocco.
Cite as: El Bakkali M, Messnaoui R, Elkhaoudi M, Cherkaoui O, Soulhi A. Predicting saturation for a new fabric using artificial intelligence (fuzzy logic): experimental part. Data and Metadata. 2024; 3:251. https://doi.org/10.56294/dm2024251
Submitted: 10-09-2023 Revised: 05-02-2024 Accepted: 19-05-2024 Published: 20-05-2024
Editor: Adrián
Alejandro Vitón Castillo![]()
ABSTRACT
Weaving saturation can have harmful consequences, such as problems with loom performance, accelerated wear of mechanical parts and loss of raw materials. To avoid these problems, when designing and creating new fabrics, the densities and yarn qualities must be carefully matched with the weaves to ensure successful testing. To facilitate this task, this study focuses on the development of a practical fuzzy logic model for predicting the saturation of new fabrics. An experimental part was carried out to validate this fuzzy model. The fabric samples used in this study came from three different types of weaves, namely plain, twill and satin. These samples also included five weft counts (Nm) and eight different densities. The results obtained using the fuzzy logic model developed were compared with experimental values. The prediction results were satisfactory and precise, demonstrating the effectiveness of the fuzzy logic model developed. The mean absolute error of the calculated fuzzy model was 1,97 %. It was therefore confirmed that this fuzzy model was both fast and reliable for predicting the saturation of new fabric.
Keywords: Weaving; Fuzzy logic; Modelling; Saturation Index; Weaveability.
RESUMEN
La saturación de los tejidos puede tener consecuencias perjudiciales, como problemas de rendimiento de los telares, desgaste acelerado de las piezas mecánicas y pérdida de materias primas. Para evitar estos problemas, a la hora de diseñar y crear nuevos tejidos, las densidades y las calidades de los hilos deben ajustarse cuidadosamente a los tejidos para garantizar el éxito de las pruebas. Para facilitar esta tarea, este estudio se centra en el desarrollo de un modelo práctico de lógica difusa para predecir la saturación de nuevos tejidos. Se llevó a cabo una parte experimental para validar este modelo difuso. Las muestras de tejido utilizadas en este estudio procedían de tres tipos diferentes de tejidos, a saber, liso, sarga y satén. Estas muestras también incluían cinco recuentos de trama (Nm) y ocho densidades diferentes. Los resultados obtenidos con el modelo de lógica difusa desarrollado se compararon con los valores experimentales. Los resultados de la predicción fueron satisfactorios y precisos, lo que demuestra la eficacia del modelo de lógica difusa desarrollado. El error absoluto medio del modelo difuso calculado fue del 1,97 %. Por lo tanto, se confirmó que este modelo difuso era rápido y fiable para predecir la saturación del tejido nuevo.
Palabras clave: Tejeduría; Lógica difusa; Modelización; Índice de Saturación; Tejibilidad.
INTRODUCTION
The design and development of new textiles to respond to specific needs is a complex and costly process. Traditionally, this involves creating multiple fabric samples, carrying out physical tests and collecting data to evaluate their performance. However, these methods are often time-consuming and resource intensive.(1) Fabric saturation is an important concept when designing a new textile item. Saturation refers to the maximum amount of yarn that can be inserted into a given fabric. Fabric saturation depends on several factors, such as the density of the weave, the type of yarn used, the type of fabric weave and specific design constraints. To determine the optimum saturation of a fabric, it is important to consider the functional requirements of the item. This can be achieved through prototype testing and evaluation, as well as the experience and knowledge of textile designers and manufacturers. A thorough understanding of the properties of different types of fabric and their specific applications is essential to ensure quality products.(2)
Artificial intelligence (AI) offers an alternative approach by using machine learning models to predict textile performance and weaveability based on prior learning data. This reduces the need to produce large numbers of physical samples and carry out costly trials and tests. Instead, AI models can be trained on existing datasets, including information about fibre composition, yarn properties, fabric structure and desired performance.(3) AI can accurately predict certain properties of textiles, such as strength, elasticity, breathability, durability, softness and so on.(4,5) AI models can recognise complex patterns in the data and make reliable predictions based on these identified patterns.(6) In addition, AI systems can be used to validate experimental results by comparing the performance predicted by the models with the actual values obtained from physical tests. This allows the accuracy of the AI predictions to be verified and the models to be adjusted if necessary.(7) The application of AI in the textile industry has many advantages. It speeds up the textile design and development process, reducing the time and costs associated with producing physical samples. In addition, AI makes it possible to explore more combinations of materials and fabric structures, paving the way for faster innovation and improvements in textiles.(2)
Several efforts have been made to define and predict the properties of textiles:
Admuthe et al.(7) have used an approach that combines two techniques, namely adaptive neuro-fuzzy inference system (ANFIS) and subtractive clustering, to predict yarn properties. ANFIS is an inference system based on neuro-fuzzy networks, allowing the advantages of neural networks and fuzzy systems to be used to model and predict complex relationships. Subtractive clustering is a data grouping method that aims to identify the underlying structures in a data set. In this context, it is used to prepare ANFIS input data by identifying groups of similar yarns.
In their research, Hussain et al.(8) demonstrated that adaptive neuro-fuzzy models slightly outperform regression models in predicting compressed air consumption in air-jet weaving. These models have shown promising potential for estimating compressed air consumption, detecting air leaks and other similar applications.
The study by Kodaloğlu et al.(9) explored the use of fuzzy logic to assess temperature physiology and occupational health in weaving companies. The detection of hazards in the work environment has been identified as a crucial factor in the prevention of work-related health problems, occupational diseases, and work-related accidents. The fuzzy logic approach offers a precise and adaptable means of assessing these risks and taking appropriate preventive measures.
M. Alsayed et al.(1) investigated the factors influencing the air permeability of multi-filament fabrics, such as the number of yarns, weave density and weave type. Microfilaments have a significant impact on the air permeability of these fabrics due to their low porosity. The study focuses on the development of a fuzzy logic model to predict the air permeability of polyester multi-filament fabrics, using conventional yarns and microfilaments. The fabric samples used include different fineness levels of microfilament and conventional filament, as well as different weave types and weave densities. The experimental results are compared with the predictions of the fuzzy logic model and regression equations. The fuzzy logic model showed satisfactory accuracy, with a lower mean absolute error than the regression analysis, confirming its superiority in predicting the air permeability of multi-filament fabrics.
T. Tundo et al.(10) have explored the use of fuzzy logic to solve production problems. Two methods are examined: the Tsukamoto method and the Sugeno method. The objective is to determine fabric production using variables such as inventory, demand, and production costs. The Tsukamoto method uses fuzzy sets for input and output variables, while the Sugeno method uses constants or mathematical functions. By comparing the results obtained with actual company data, it is concluded that the Tsukamoto method with Weka rules is the closest to actual fabric production.
Hussain MAI et al.(11) presented a deep learning model using residual network (ResNet) for textile weave pattern recognition and classification. The model incorporates data augmentation techniques to improve its generalisability and was evaluated using metrics such as accuracy, balanced accuracy and F1 score. The experimental results demonstrate the robustness of the model, with high performance even when the physical properties of the fabric are modified. Compared with other approaches, notably the VGGNet pre-trained model, the proposed model achieves superior accuracy, particularly when considering rotation and lighting effects. In conclusion, this deep learning model offers high accuracy in the recognition of weaving patterns and has great potential for future applications in the textile field.
L. K. Ncube et al.(12) presented in their paper the development of a fuzzy logic-based tool for managing textile weaving production in the context of increasing customer orders. The tool, developed using MATLAB, aims to optimise the use of limited raw materials and make efficient decisions. Using this fuzzy logic module, it is possible to determine the optimum number of orders that can be processed as a function of the raw materials available, and the number of orders received. Model verification results show that the tool could process 80 % of orders received, a significant improvement on the 50 % currently processed. This potential improvement could lead to a 30 % increase in production and a 1,2 % increase in daily profits. Using fuzzy logic, this tool offers a solution for optimising order management, maximising the efficiency of raw material use and improving the overall performance of the textile production process.
S. A. Malik et al.(13) focuses on the analysis of polyester barrier fabrics (PES) and aims to establish a correlation between air permeability and influential parameters such as material, construction, and manufacturing process. Artificial neural network (ANN) models were developed to map the relationships between input and output variables. Three ANN models were optimised according to the number of input variables, and the one that used all the selected inputs showed the best results. ANN makes it possible to adjust the permeability of barrier fabrics according to specific needs, by optimising the parameters of the looms, fabrics, and yarns. This approach avoids costly and time-consuming testing. In summary, the study demonstrates the effectiveness of using ANN to analyse and optimise the air permeability of PES barrier fabrics.
However, to the best of our knowledge, no study has yet been carried out on the prediction of weaving saturation of a new fabric using a fuzzy system.(2)
The aim of our research is to develop a fuzzy logic-based model for predicting the saturation of a new fabric and to compare the results of this model with experimental results on looms. Weaveability refers to the ability of a material to be woven successfully in a textile manufacturing process (weaving).
To achieve this objective, we draw on existing expertise in weaveability and textile manufacturing technologies. We examine the fundamental knowledge and principles that influence weaving, such as context, weaving parameters, interactions between yarns, etc. We then use this knowledge to develop a model based on fuzzy logic.
We then use this knowledge to develop a model based on fuzzy logic. Fuzzy logic can handle uncertain or imprecise information, which is particularly well suited to the complexity of the weaving process. Once our model is built, we plan to carry out an experimental part to confirm the results obtained. This involves making fabric samples on looms using different combinations of materials, weaving parameters, etc. We will then compare the experimental results with the predictions of our model to assess its accuracy and reliability.
For the experimental part, our research focuses on exploring weaveability limits and saturation indices in the weaving domain. Understanding these limits is essential for optimising textile manufacturing processes and guaranteeing the quality of end products. In addition, we will examine saturation indices, which determine the maximum yarn absorption or retention capacity of a new fabric. Our experimental section will present the results of these earlier studies, allowing us to deepen our understanding of these important aspects of weaveability.
Saturation indexes
Two important geometric parameters are required to calculate the weaveability limit: the yarn diameter and the weave factor.
Yarn diameter
Most researchers in this field have assumed that the yarn is a uniform cylinder to make it easier to calculate the yarn diameter.(3,14,15,16,17) With such an assumption, the yarn diameter can be written as follows:
Weight of 1 metre of yarn:
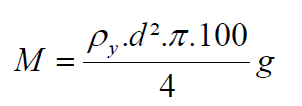
(1)
Yarn count:
![]() (2)
(2)
The result is:
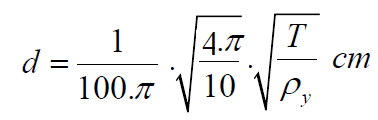
(3)
With:
d: Yarn diameter (cm)
T: Linear mass of yarn (tex)
ρy: Density of the yarn (g/cm3)
Weave factor
The weave factor is the number of times the warp and weft yarns are interlaced.
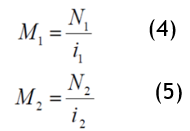
With:
M1: Warp weave factor
N1: Number of warp yarns in the weave report
i1: Number of warp yarn face changes in the weave report
M2: Weft weave factor
N2: Number of weft yarns in the weave report
i2: Number of weft yarn face changes in the weave report.
|
Table 1. Weave factor |
|||||||||||||||||||||||
|
Weave |
|
N1 |
i1 |
M1 |
N2 |
i2 |
M2 |
||||||||||||||||
|
Plain |
|
2 |
2 |
1 |
2 |
2 |
1 |
||||||||||||||||
|
Z-twill |
|
4 |
2 |
2 |
4 |
2 |
2 |
||||||||||||||||
|
Satin |
|
4 |
2 |
2 |
4 |
2 |
2 |
||||||||||||||||
The theories of maximum construction
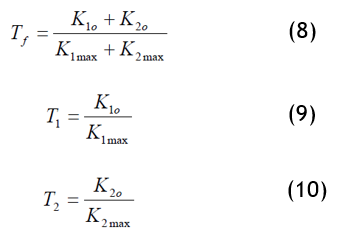
Ashenhurst's theory
Ashenhurst makes the calculations easier by assuming that the yarn structure is cylindrical.(3) It also assumes that the distance between two yarns when changing yarn face is equal to the yarn diameter. Figures 1 and 2 illustrate the geometry according to Ashenhurst's theory.
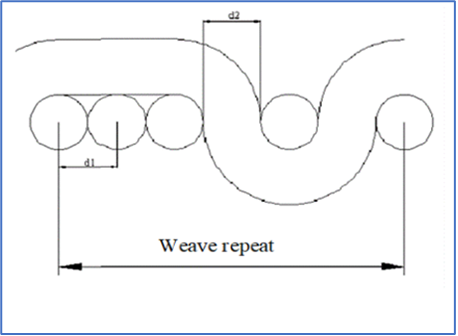
Figure 1. Warp cross section
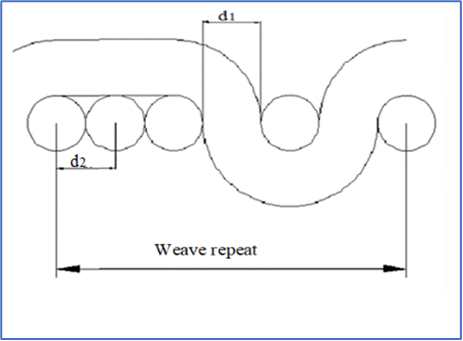
Figure 2. Weft cross section
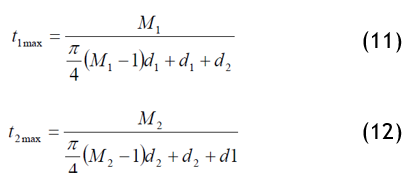
The maximum constructions are given by the equations:
Avec:
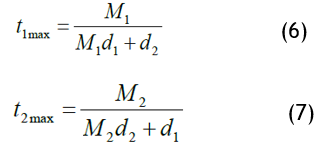
With:
t1max: maximum number of picks per unit length
t2max: number of warp yarns per unit width
M1: warp weave factor
M2: weft weave factor
d1: diameter of warp yarn
d2: diameter of weft yarn
Law's rules(18)
Law's experimental work demonstrated that Ashenhurst's equations are applicable to fabrics with short floats.(14) However, in fabrics with larger floats, Law found that it was possible to obtain a tighter structure than that predicted by Ashenhurst's 'maximum construction' theory.
According to Law's theory, in fabrics with a weave factor of less than two, the gap between two yarns when changing face is equal to the diameter of the yarn changing face. However, when the weave factor exceeds two, the 'maximum construction' increases by a specific percentage depending on the type of weave. For example, for a twill weave with a weave factor greater than two, an increase of 5 % is required. This same percentage also applies to satin and basketweave. For other weaves with a weave factor greater than two, a percentage of 10 % must be added.
The Love index(17)
Love has defined three saturation index formulae which are described in the following equations:
With:
Tf: Saturation index for the fabric
Tf: Saturation index for the warp
T2: Saturation index for the weft
K1o: Coverage factor for the warp of the article
K1max: Maximum warp coverage factor
K2o: Item weft coverage factor
K2max: Maximum screen coverage factor.
The saturation formulas of Seyam et al.(15,19)
Seyam and El Shiekh saturation formulas (Figure 3):
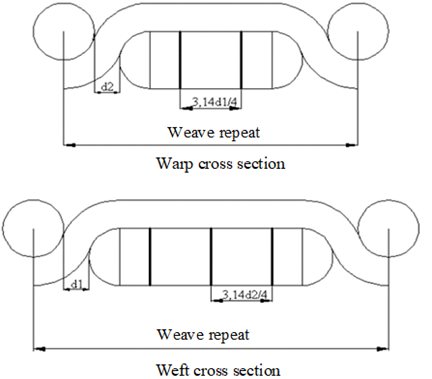
Figure 3. Fabric geometry according to Seyam and El Shiekh
Seyam et al.(15,19) found, by comparing indices, that their proposed solution is suitable for use with common weaves, such as plain weave up to a weave repeat of 13, twill up to a weave repeat of 10 and plaited up to a weave repeat of 8. These types of weaves, which account for almost 90 % of all woven items, can benefit from their practical approach.
The Booten index(16)
Booten established his saturation index based on the following assumptions: the yarns used, whose count is known, have cylindrical cross-sections.
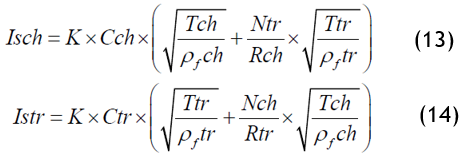
With:
K: Constant (k=0,36)
Cch: Warp count per cm
Ctr: Weft count per cm
Nch: Warp number of face changes by report
Rch: Warp pattern report
Ntr: Weft number of face changes by report
Rtr: Weft pattern report
ρf ch: Density of warp yarn (g/cm3)
ρf tr: Density of weft yarn (g/cm3)
Tch: Warp yarn count (in Tex)
Ttr: Weft yarn count (in Tex).
Overall index:
 (15)
(15)
Booten acknowledges that the values for Isch (warp saturation index) and Istr ("weft saturation index") should not exceed 80 to 85, which corresponds to a maximum of 64 to 72 for Ist (overall saturation index).
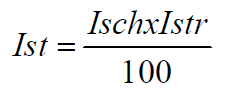
The DALAL index(3)
Based on Booten's indices,(16) Dalal introduced a packing coefficient (φ) equal to yarn density (ρy) over fibre density (ρf).(3) In addition, another parameter α which considers the weaving tension. With: 0 ≤ α ≤1.
The saturation equations are:
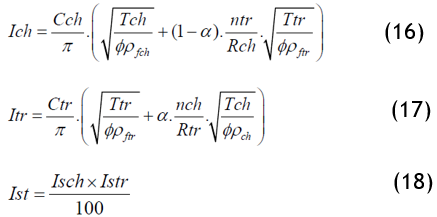
With:
Shrinkage warp = Shrinkage warp "Max".α
Shrinkage weft = Shrinkage weft "Max ".(1−α)
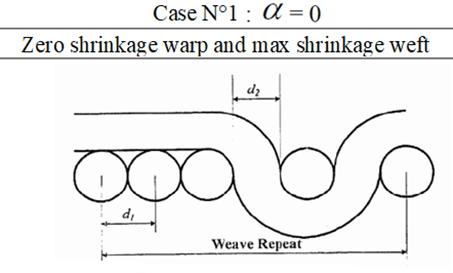
Figure 4. Warp cross section
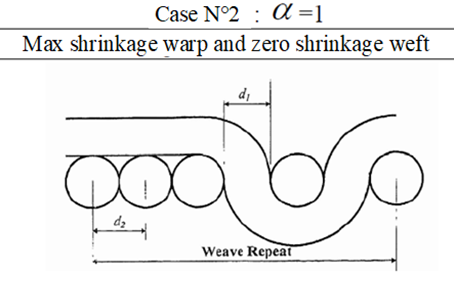
Figure 5. Weft cross section
In our study, and as we are looking for fabric saturation, we will work with a high tension (α=1): maximum fogging and zero shrinkage. In this case, the saturation equation will be as follows:
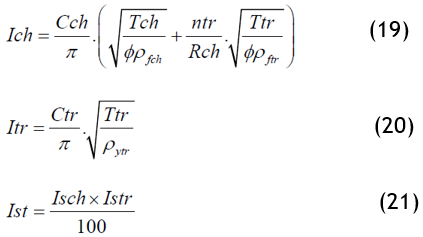
With:
Ich = Isch: warp saturation index
Itr=Istr: weft saturation index
Ist: fabric saturation index
Cch: real warp count
Ctr: real weave count
Rch: Warp weave report
ntr: Number of weft face changes / warp report
ρf ch: Density of warp yarn (g/cm3)
ρf tr: Density of weft yarn (g/cm3)
ρytr: Density of weft yarn (g/cm3)
Tch: Warp yarn count (in Tex)
Ttr: Title of weft yarn (in Tex)
METHODOLOGY
In the first stage of our study, we will experimentally investigate weaveability limits: In this stage, several fabric samples were woven on a loom with three basic types of weaves (plain, twill and satin). The weaving density is increased: the filling is gradually increased until saturation is reached. This means that the fabric samples were evaluated with higher and higher counts until it was no longer possible to insert other yarns without causing weaving problems.
Then, after obtaining the fabric samples and the corresponding experimental data, a fuzzy model based on artificial intelligence was developed. A fuzzy model is an AI method that uses fuzzy sets to represent and handle parameter uncertainty and variability.(20,21) This model was trained on expert data to predict weaveability limits when weaving a new fabric. Once the fuzzy model has been developed and trained, it can be used to predict the weaveability limits of a new fabric without the need for machine trials. This saves time and resources by avoiding the loss of time, material and potential mechanical damage caused by weaving tests.
Finally, a comparison is made between the experimental results obtained during the study of weaveability limits and the predictions of the fuzzy model. This comparison is used to assess the effectiveness and accuracy of the fuzzy model in predicting weaveability limits.
Materials
Samples of fabric with polyester warp and cotton weft were produced with three variables: the type of weave (plain, twill and satin), the count (Nm) of the weft yarns and the density of the weft (number of picks / cm).
Characteristics of the loom and wefts used:
Flexible rapier dobby loom:
Speed: 450 strokes/min.
Warp:
Polyester yarn titre: 300 Den.
Warp count = 30 yarns/cm
Weft:
Cotton textile material
Variable weft count with variable titre (Nm)
Width 174 cm
Weft qualities:
Cotton Nm: 10, 15, 20, 25, 30, 35, 40, 45, 50 and 60.
We evaluate different weaves and for each weave, we increase the picks on the machine until the fabric is saturated: we start with normal picks, then strong picks and increase to saturated picks for each type of weave and weft count with the following parameters:
Fixed parameters: warp qualities and their characteristics.
Variable parameters (Weft): picks per cm and Nm.
Variable parameters (Weaves): plain, twill and satin.
We made various representative fabric samples by varying the weft quality, increasing the number of wefts per cm, and tensioning the warp until the fabrics reached saturation.
For each weft quality, the saturation repeat is the average of five trials on the loom.
Fuzzy model
Fuzzy logic, also known as fuzzy logic, is a branch of mathematics and artificial intelligence that deals with concepts or situations that cannot easily be defined in binary terms (true or false), but which can take on intermediate values.(22)
Fuzzy logic was developed to model and reason about complex problems characterised by uncertainty, imprecision, or ambiguity. Unlike classical logic, which uses strict and precise rules, fuzzy logic allows the gradation between different states of a concept to be considered.(23)
Fuzzy logic uses fuzzy sets, which are sets in which the membership of an element is determined by a membership function that can take a value between 0 and 1. This membership function quantifies the degree to which an element belongs to a given set.
Fuzzy logic is used in many fields, such as system control, decision-making, pattern recognition, robotics, and artificial intelligence in general.(24,25,26) It can be used to model complex problems by taking uncertainty and imprecision into account, making it particularly suitable for dealing with real-life situations where concepts cannot easily be defined in binary terms.
Fuzzy logic essentially comprises fuzzification, an inference engine and defuzzification. As shown in figure 6 below.
Fuzzification is the conversion of crisp values into fuzzy values. Variables are represented by membership functions that assign a degree of membership to different linguistic terms or fuzzy sets.
The choice of membership form depends on the specific problem and the data available. The triangular (figure 7) form is often used because it is simple to understand and interpret and allows intuitive modelling of linguistic variables. However, trapezoidal, and Gaussian membership function shapes can also be used, depending on the requirements of the problem and the characteristics of the data.
Fuzzy Knowledge Base
Three fabric variables were used to develop the fuzzy prediction model: yarn count (Nm), weft count (number of picks per cm) and weave type (plain, twill and satin). These variables were used as inputs to the model, while the fabric saturation index was used as an output variable. These variables were found to be the most significant predictors of fabric saturation.
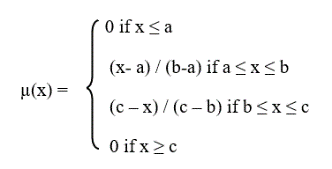
In terms of fuzzification, five Nm of the weft yarn, namely: Nm10, Nm20, Nm30, Nm50 and Nm60 (figure 8) and the loom saturation counts, namely: 10, 15, 17, 24, 33, 38, 43 and 49 (figure 9) were used as numerical (quantitative) input variables. And three weave types (plain, twill and satin) were determined as linguistic (qualitative) input variables (figure 10). Three fuzzy output sets (possible weave, saturation, and impossible weave) for the saturation index are shown in (figure 11).
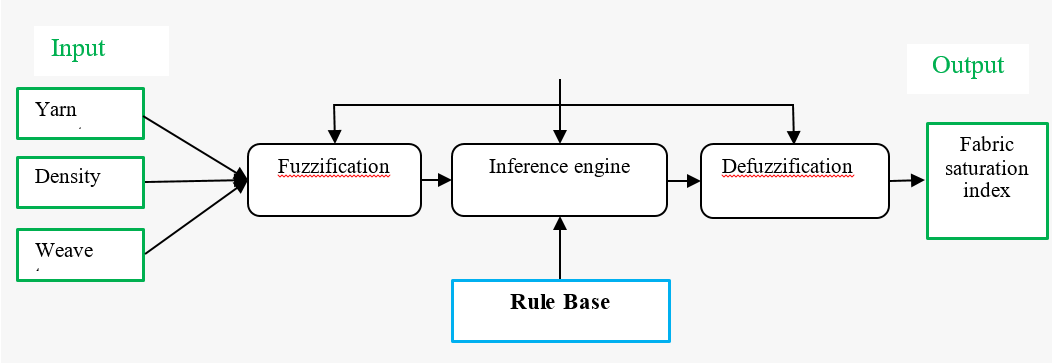
Figure 6. Fuzzy Inference Process
The triangular form is defined by the equation (22):
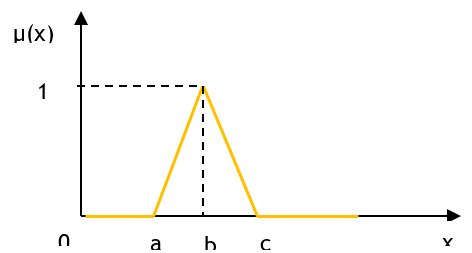
Figure 7. The Triangle Membership Function
(22)
Three fabric variables were used to develop the fuzzy prediction model: yarn count (Nm), weft count (number of picks per cm) and weave type (plain, twill and satin). These variables were used as inputs to the model, while the fabric saturation index was used as an output variable. These variables were found to be the most significant predictors of fabric saturation.
In terms of fuzzification, five Nm of the weft yarn, namely: Nm10, Nm20, Nm30, Nm50 and Nm60 (figure 8) and the loom saturation counts, namely: 10, 15, 17, 24, 33, 38, 43 and 49 (figure 9) were used as numerical (quantitative) input variables. And three weave types (plain, twill and satin) were determined as linguistic (qualitative) input variables (figure 10). Three fuzzy output sets (possible weave, saturation, and impossible weave) for the saturation index are shown in (figure 11).
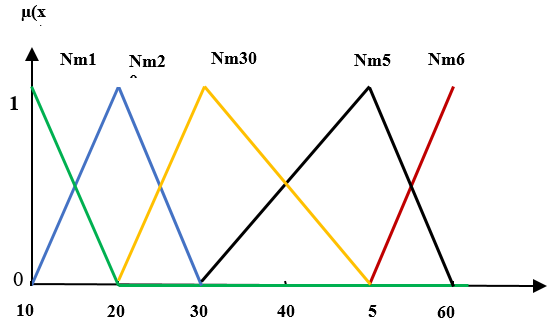
Figure 8. Input of yarn weft (Nm)
Figure 9. Input of Weft density
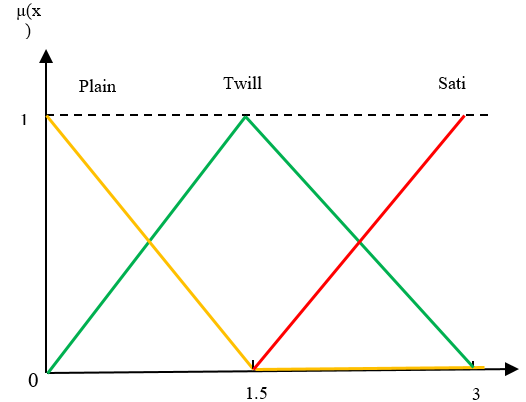
Figure 10. Input of weave type
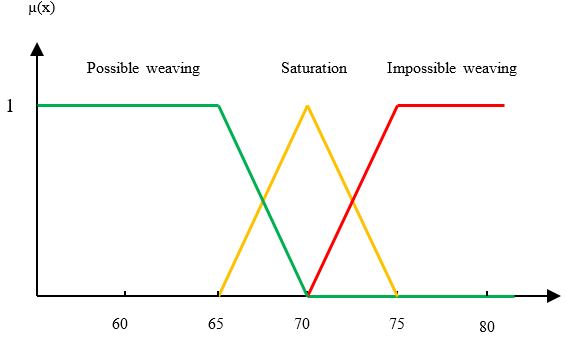
Figure 11. Output of saturation index
Fuzzy inference is a method that allows us to make decisions using rules expressed using linguistic terms.The inference rules are written as follows:(27)
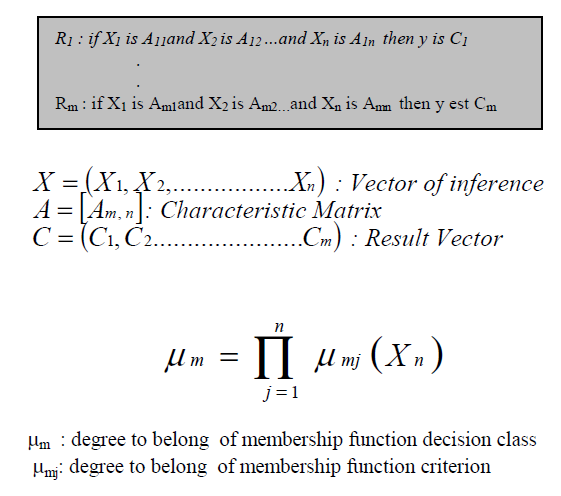
(23)
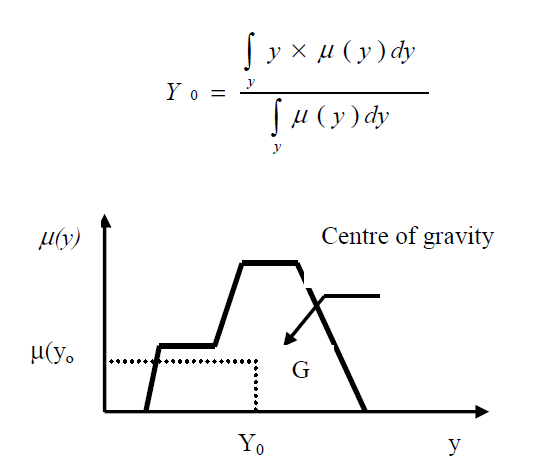
Defuzzification is the process of converting the variables characterising the overall efficiency of a system, expressed in linguistic or fuzzy terms, into a numerical value. In this context, the centre of gravity method is used to consider all the available information and obtain a precise value representing overall efficiency.
 (24)
(24)
MATLAB's Fuzzy software was used to create fuzzy control surfaces, which are shown in figure 12.
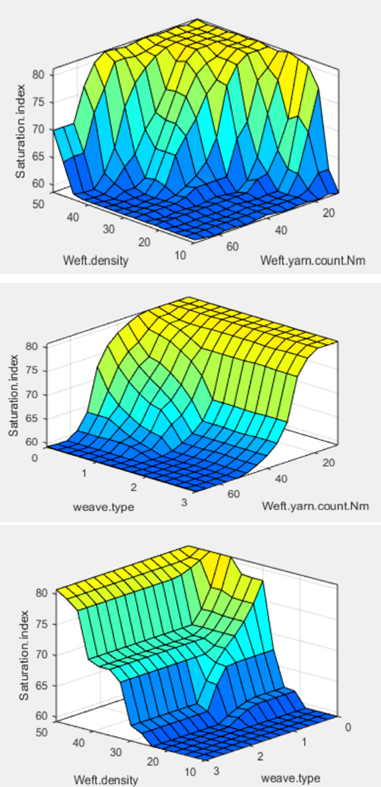
Figure 12. Surface Viewer
Figure 12 graphically illustrates the relationship between weave type, weft count and weave density on the input side, and the saturation index of weaveability on the output side.
To validate the effectiveness of the fuzzy system developed, Nm15, 25, 35, 40 and 45 and their saturation densities for the three weaves were used to validate the effectiveness of the model.
The fuzzy prediction model is shown in (figure 13), which clearly explains the process.
One example of prediction:
If the weft count = 15 and the weft density = 14 and the weave is a plain weave then the saturation index = 70 (saturated weave).
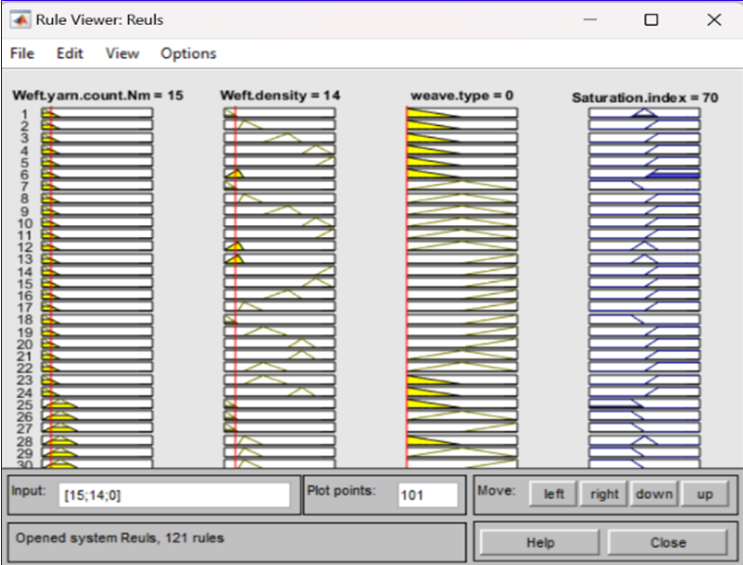
Figure 13. Rule viewer of developed fuzzy model
RESULTS AND DISCUSSION
Figures 14, 15 and 16 show the experimental results in the form of saturation curves for fabric samples in the three weave types (plain weave, twill, and satin).
When examining fabric saturation, three key factors are often considered: the type of weave, the weft count, and the weft density (number of picks per centimetre). Weft count refers to the thickness or fineness of the yarn used in the manufacture of the fabric, measured in Nm.
In our experiment, by fixing the type of weave, we observed a strong correlation between the count of the weft and the number of picks per centimetre, as indicated by the high coefficients of determination (R²): R² = 0,9953 for plain weave, R² = 0,9968 for twill and R² = 0,9894 for satin.
When the yarn used for the weft is finer, i.e. has a high Nm count, it tends to have a greater surface area per unit mass. Therefore, to achieve saturation of the fabric, it is necessary to increase the number of picks in the fabric, i.e. to increase the number of weft yarns per centimetre.
The positive correlation we observe between the weft count and the number of picks per centimetre is therefore logical and expected. It highlights the fact that to achieve saturation of the fabric, the number of picks needs to be adjusted according to the count of the weft yarn used.
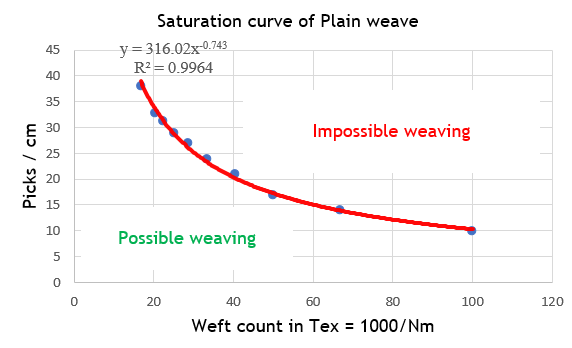
Figure 14. Saturation curve for plain weave
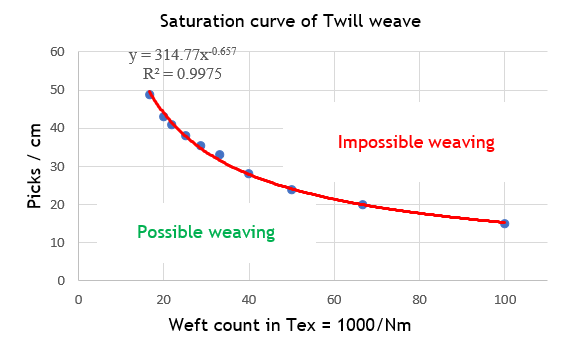
Figure 15. Saturation curve of Twill weave
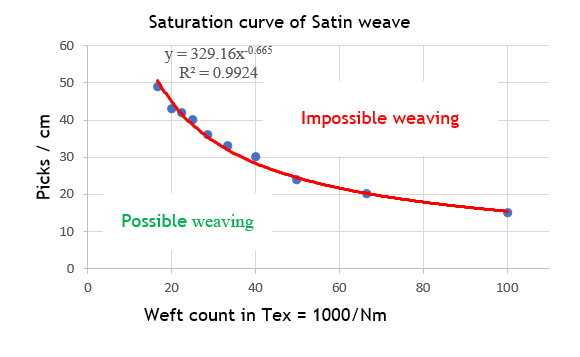
Figure 16. Saturation curve of Satin weave
Table 2 shows the experimental results of the fabric saturation index and the values of the same index given by the fuzzy logic model developed for 15 samples.
The percentage error between the experimental results and the predicted methods is calculated and the average absolute error of the fuzzy model is 1,97 %. This indicates that the predictions of the fuzzy logic model are very close to reality. In other words, the model succeeded in accurately capturing the relationships and trends present in the experimental data.
Such a low percentage of error indicates that the fuzzy logic model is reliable and can be used to make accurate predictions in this specific area.
|
Table 2. Comparison of predicted and experimental values for saturation index |
||||||
|
|
|
|
|
Saturation index % |
|
|
|
Sample |
Weave |
Nm |
Picks/cm |
Experience |
Fuzzy logic |
Err % |
|
1 |
Plain |
15 |
14 |
69,17 |
70 |
1,20 |
|
2 |
|
25 |
21 |
69,95 |
70,8 |
1,22 |
|
3 |
|
35 |
27 |
69,98 |
71,2 |
1,74 |
|
4 |
|
40 |
29 |
68,18 |
70,6 |
3,56 |
|
5 |
|
45 |
31,5 |
68,01 |
71,5 |
5,13 |
|
6 |
Twill |
15 |
20 |
70,39 |
70 |
0,56 |
|
7 |
|
25 |
28 |
69,39 |
69,4 |
0,02 |
|
8 |
|
35 |
36 |
70,28 |
72 |
2,45 |
|
9 |
|
40 |
38 |
69,08 |
70 |
1,33 |
|
10 |
|
45 |
41 |
68,65 |
68 |
0,95 |
|
11 |
Satin |
15 |
20 |
70,39 |
70 |
0,56 |
|
12 |
|
25 |
30 |
74,35 |
71,9 |
3,29 |
|
13 |
|
35 |
36 |
71,38 |
74,1 |
3,81 |
|
14 |
|
40 |
40 |
72,72 |
70 |
3,74 |
|
15 |
|
45 |
42 |
70,78 |
70,8 |
0,02 |
|
|
|
|
|
Mean absolute error % |
1,97 |
|
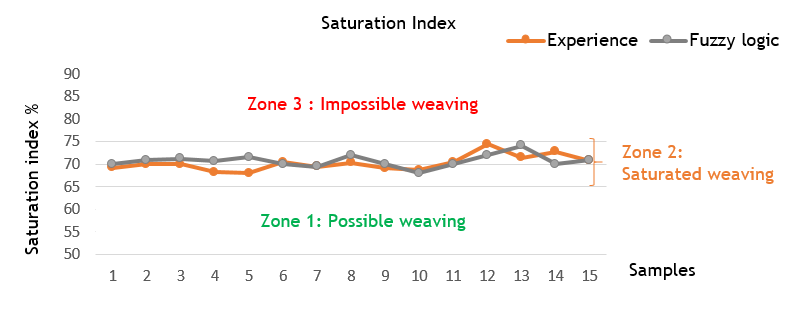
Figure 17. Weaving zones
Figure 17 shows the three weaving zones (possible weaving, saturated weaving, and impossible weaving) and the values of the experimental and fuzzy logic model. After analysing the experimental results and the predictions of the fuzzy logic model, an important observation is the agreement between the experimental curve and the predicted curve. This means that the values predicted by the fuzzy logic model follow a similar trend to that observed in the experimental data.
This agreement suggests that the fuzzy logic model was able to accurately capture the relationships and behaviours present in the real data. The model's predictions were able to reproduce the general shape of the experimental curve, reinforcing confidence in its ability to provide accurate results.
This observation is encouraging as it indicates that the fuzzy logic model can be reliably used to make predictions in this specific domain. It can be considered an effective tool for modelling and simulating complex phenomena, providing results that are in close agreement with actual observations.
This opens possibilities for using the fuzzy logic model in practical applications such as process optimisation, task planning or predicting future outcomes. The agreement between the experimental curve and that predicted by fuzzy logic is an important indicator of the performance and accuracy of the model in this specific context.
CONCLUSIONS
Globalization has led to faster and more efficient global supply chains,(28) while creating competitive pressure to reduce lead times in the textile industry. Still, after designing and creating new fabrics, we need to run tests to confirm weaveability, which wastes time, material, and resources. Our fuzzy logic model developed on MATLAB can predict the test result with an average absolute error of 1,97 %.
The model developed has been widely and successfully used in numerous experiments. It has demonstrated its ability to solve complex problems and provide accurate and reliable results. Users have been satisfied with the performance of the model, which has helped to speed up the design and creation processes for new products (fabrics).
Due to its promising performance, the model will now be tested in a weaving mill before being marketed. This step is crucial to assess the model's effectiveness in a real textile production environment.
REFERENCES
1. Alsayed M, Çelik Hİ, Kaynak HK. Predicting air permeability of multifilament polyester woven fabrics using developed fuzzy logic model. Text Res J. 2021;91(3–4):385–97.
2. El Bakkali M, Messnaoui R, Cherkaoui O, Soulhi A. Predicting the Difficulty of Weaving a New Fabric Using Artificial Intelligence (Fuzzy Logic). J Theor Appl Inf Technol. 2023;101(24):8291–8.
3. Dalal M, Drean JY, Osselin JF. Geometrical modeling of woven fabrics weavability-Limit new relationships. Autex Res J. 2017 Mar 1;17(1):73–84.
4. Predicting abrasion behaviour of chenille fabric by fu zzy logic. Vol. 31, Indian Journal of Fibre & Textile Research. 2006.
5. Ali Z, Mumtaz M&, Malik H, Hussain T, Tanwari A. Predicting strength transfer efficiency of warp and weft yarns in woven fabrics using adaptive neuro-fuzzy inference system. Vol. 35, Indian Journal of .Fibre & Textile Research. 2010.
6. Kuo, Shih CY, Lee JY. Automatic Recognition of Fabric Weave Patterns by a Fuzzy C-Means Clustering Method. Text Res J. 2004;74(2):107–11.
7. Admuthe LS, Apte S. Adaptive Neuro-fuzzy Inference System with Subtractive Clustering: A Model to Predict Fiber and Yarn Relationship. Text Res J. 2010;80(9):841–6.
8. Hussain T, Jabbar A, Ahmed S. Comparison of regression and adaptive neuro-fuzzy models for predicting the compressed air consumption in air-jet weaving. Fibers Polym. 2014;15(2):390–5.
9. KODALOĞLU M, AKARSLAN KODALOĞLU F. EVALUATION OF THERMAL COMFORT IN TERMS OF OCCUPATIONAL SAFETY IN WEAVING FACILITIES BY FUZZY LOGIC. Int J 3D Print Technol Digit Ind. 2022 Aug 31;6(2):273–9.
10. Tundo T, Sela EI. Application of The Fuzzy Inference System Method to Predict The Number of Weaving Fabric Production. IJID (International J Informatics Dev. 2018;7(1):19.
11. Hussain MAI, Khan B, Wang Z, Ding S. Woven fabric pattern recognition and classification based on deep convolutional neural networks. Electron. 2020;9(6):1–12.
12. Ncube LK, Chikowore TR, Sibanda NR. Textile Weaving Order Planning Decision Support Tool Based on Fuzzy Logic. IOSR J Eng. 2018;8(3):2278–8719.
13. Malik SA, Kocaman RT, Kaynak HK, Gereke T, Aibibu D, Babaarslan O, et al. Analysis and prediction of air permeability of woven barrier fabrics with respect to material, fabric construction and process parameters. Fibers Polym. 2017 Oct 1;18(10):2005–17.
14. T.R. Ashenhurst. A treatise on textile calculations and the Structure of Fabrics, 1884.1 Broadbent, London. 1884;1884.
15. Seyam A, El-Shiekh A. Mechanics of Woven Fabrics. Text Res J. 1995;65(1):14–25.
16. Booten, E., Die Berechnug wirtschaftlicher Gewebekonstruktionen Textilbetrieb 1976.
17. Love L. Graphical Relationships in Cloth Geometry for Plain, Twill, and Sateen Weaves. Text Res J. 1954;24(12):1073–83.
18. W. Law. A Practical Treatise on Cloth Building. Wool Rec., 1922, 21,968 et seq. (series concluding on 1486). 1922;1922.
19. Seyam A, el-Shiekh A. Mechanics of Woven Fabrics: Part I: Theoretical Investigation of Weavability Limit of Yarns with Thickness Variation. Text Res J. 1990;60(7):389–404.
20. Tabit S, Soulhi A. a Model for Supplier Selection in Manufacturing Industries. J Theor Appl Inf Technol. 2022;100(20):6073–82.
21. Tabit S, Soulhi A. Developing a Decision -Making for Outsourcing Applying Fuzzy Analytical Hierarchy Process (Fahp). J Theor Appl Inf Technol. 2022;100(10):3246–58.
22. Liu CW, Kang SC. A video-enabled dynamic site planner. Comput Civ Build Eng - Proc 2014 Int Conf Comput Civ Build Eng. 2014;353:1562–9.
23. Messnaoui R, El Bakkali M, Soulhi A, Cherkaoui O. Application of Fuzzy Logic in Weaving Process: a Systematic Literature Review. J Theor Appl Inf Technol. 2023;101(23):8008–27.
24. Mortada A, Soulhi A. a Decision-Making Model Based on Fuzzy Logic To Support Maintenance Strategies and Improve Production Lines Productivity and Availability. J Theor Appl Inf Technol. 2023;101(13):5288–97.
25. Mortada A, Soulhi A. A DECISION-MAKING MODEL FOR QUALITY. 2023;101(13).
26. Mortada A, Soulhi A. a Fuzzy Logic Model for Ensuring Customer Satisfaction and Preventing Complaints About Quality Defects. J Theor Appl Inf Technol. 2023;101(14):5771–80.
27. Nationale E, Industrie D, Alami N El. DECISION-MAKING AUTOMATION FUZZY DECISION-MAKING IN INDUSTRY Aziz Soulhi and Said Guedira 5 . The indicators modeling by. World Sci Eng Acad Soc. 2009;Pages 181–185.
28. Ahlaqqach M, Benhra J, Mouatassim S, Lamrani S. Closed loop location routing supply chain network design in the end of life pharmaceutical products. Supply Chain Forum [Internet]. 2020;21(2):79–92. Available from: https://doi.org/10.1080/16258312.2020.1752112
FINANCING
None.
CONFLICT OF INTEREST
The authors declare that there are no conflicts of interest.
AUTHORSHIP CONTRIBUTION
Conceptualization: Mhammed El Bakkali, Redouane Messnaoui, Mustapha Elkhaoudi.
Data curation: Mhammed El Bakkali.
Formal analysis: Mhammed El Bakkali, Redouane Messnaoui, Mustapha Elkhaoudi.
Research: Mhammed El Bakkali.
Methodology: Mhammed El Bakkali, Redouane Messnaoui, Mustapha Elkhaoudi.
Supervision: Omar Cherkaoui, Aziz Soulhi.
Validation: Aziz Soulhi.
Original drafting and editing: Mhammed El Bakkali, Redouane Messnaoui, Mustapha Elkhaoudi.
Writing - proofreading and editing: Mhammed El Bakkali, Aziz Soulhi.