doi: 10.56294/dm2024238
ORIGINAL
A Study of Factors Influencing Happiness in Korea: Topic Modelling and Neural Network Analysis
Estudio de los factores que influyen en la felicidad en Corea: Modelización de temas y análisis de redes neuronales
Ji-Hyun Jang1 ![]() *, Masatsugu Nemoto2
*, Masatsugu Nemoto2 ![]() *
*
1Associate Professor, College of Liberal Arts Sangmyung University, Cheonan, KOREA.
2Research Professor, Chungbuk National University, Cheongju, KOREA.
Cite as: Jang J-H, Nemoto M. A Study of Factors Influencing Happiness in Korea: Topic Modelling and Neural Network Analysis. Data and Metadata. 2024;3:238. https://doi.org/10.56294/dm2024238
Submitted: 10-10-2023 Revised: 16-01-2024 Accepted: 13-03-2024 Published: 14-03-2024
Editor: Prof.
Dr. Javier González Argote ![]()
ABSTRACT
The aim of this study is to derive the important factors that influence levels of happiness in Korea, and to identify which factors are particularly important among these influencing factors. To achieve this goal, topic modelling analysis, machine learning analysis and neural network analysis methods were utilized. The Netminer 4.5 program was used for topic modelling analysis and machine learning analysis, and SPSS MODELER 18 was used to perform neural network analysis. Two types of analysis data were used in this study. The first consisted of 1 000 papers relating to happiness published in academic journals managed by the Springer publishing company, which were used to derive happiness-influencing factors. The second consisted of a survey conducted in 2020 by the Community Well-being Center of the Graduate School of Public Administration at Seoul National University in Korea. A total of 16 655 people responded to this survey. The analysis results of the study are as follows. Important variables that affect the level of happiness of Korean residents are: family life, social status, income, health, and perceptions of inequality. Analysis using neural network analysis of the most important factors influencing happiness showed that satisfaction with family life had the most important influence. This suggests that policies that can improve the quality of family life, such as family-friendly work environments, childcare support, and domestic violence prevention and response programmes, will become important in the future.
Keywords: Happiness Research; Neural Network Analysis; Topic Modelling; Machine Learning.
RESUMEN
El objetivo de este estudio es deducir los factores importantes que influyen en los niveles de felicidad en Corea, e identificar qué factores son particularmente importantes entre estos factores de influencia. Para lograr este objetivo, se utilizaron métodos de análisis de modelos temáticos, análisis de aprendizaje automático y análisis de redes neuronales. Se utilizó el programa Netminer 4.5 para el análisis de modelización de temas y el análisis de aprendizaje automático, y SPSS MODELER 18 para realizar el análisis de redes neuronales. En este estudio se utilizaron dos tipos de datos de análisis. El primero consistió en 1 000 artículos relacionados con la felicidad publicados en revistas académicas gestionadas por la editorial Springer, que se utilizaron para derivar los factores que influyen en la felicidad. El segundo consistió en una encuesta realizada en 2020 por el Centro de Bienestar Comunitario de la Escuela Superior de Administración Pública de la Universidad Nacional de Seúl (Corea). Un total de 16 655 personas respondieron a esta encuesta. Los resultados del análisis del estudio son los siguientes. Las variables importantes que afectan al nivel de felicidad de los residentes coreanos son: vida familiar, estatus social, ingresos, salud y percepción de la desigualdad. El análisis mediante redes neuronales de los factores más importantes que influyen en la felicidad mostró que la satisfacción con la vida familiar tenía la influencia más importante. Esto sugiere que las políticas que pueden mejorar la calidad de la vida familiar, como los entornos laborales favorables a la familia, el apoyo al cuidado de los niños y los programas de prevención y respuesta a la violencia doméstica, cobrarán importancia en el futuro.
Palabras clave: Investigación sobre la Felicidad; Análisis de Redes Neuronales; Modelización de Temas; Aprendizaje Automático.
INTRODUCTION
Research on factors affecting happiness (Diener et al., 1999; Lyubomirsky, 2007; Seligman, 2002; Ryan and Deci, 2001; Aghaei et al., 2013) has been conducted extensively and continuously. The reason for this is that mental health problems such as stress, depression and anxiety are increasing in modern society, and understanding the factors that affect happiness can help prevent and alleviate these problems. On the basis of the results of research on happiness, governments and organizations should be able to develop more effective policies in various fields such as education, employment and welfare. In addition, when individuals learn about the factors affecting happiness they can find specific ways of improving their lives (Badiora and Abiola, 2017; Chen et al., 2020). For example, if a person knows that factors such as relationships, hobbies and meditation can contribute to their personal happiness, they can devote more time and effort to these areas. Additionally, happiness research can play an important role in strengthening relationships and bolstering a sense of community between people. Research showing that happiness increases when people are connected and support each other can contribute to strengthening social cohesion (Darbanastaneh & Mahmoudi, 2016; Esmaeilpour & Jafarjalal, 2019).
For these reasons, research on factors affecting happiness is extensive and has developed in various directions over time. This includes research across multiple disciplines, including psychology, sociology, economics and neuroscience. Early research (Diener et al., 1999; Csikszentmihalyi, 1990) mainly focused on internal factors such as an individual’s personality, attitudes and expectations. The results revealed that psychological traits such as optimism, self-efficacy and gratitude are closely related to happiness. In addition, some studies (Fredrickson, 2009; Veenhoven, 1984; Abedi et al., 2014) have emphasized that socioeconomic status, education level and income level are also important factors affecting happiness, and other studies (Amazonas et al., 2019; Di Castro et al., 2018) have shown that a high income level has a positive effect on happiness up to a certain point. The concept of ‘limits of satisfaction’, which states that the increase in happiness slows down above a certain level, has also been proposed.
In addition, recent research (Galenkamp et al., 2020; Maja & Ayano, 2021; Pomeroy et al., 2020) has revealed that specific brain regions and neurotransmitters are related to happiness. These studies suggest that happiness is more than just a subjective experience and has a biological basis.
As mentioned above, many studies have been conducted on the factors influencing happiness. However, most of the research to date has been limited to a sample of several hundred people or has been conducted by surveying a small number of members of a specific region or organization. As a result, the sample size has been overly limited and confined to specific regions or population groups, making generalization difficult. In addition, because these studies were conducted using variables obtained through limited literature research, many limitations were exposed in terms of objectivity.
To overcome these problems, the present study first extracts 1 000 academic papers on happiness and performs a topic modelling method on these papers to derive influential factors that affect happiness. Next, a neural network analysis is performed using the derived influencing factors as independent variables and the happiness variable as the dependent variable. Through this neural network analysis, we seek to derive the most important variables that affect happiness. The analysis data stem from a survey, conducted in January 2020 by the Community Well-being Center of Seoul National University’s Graduate School of Public Administration, of 16 555 local residents in 226 local authorities in Korea.
Review of prior research and research questions
Studies on the factors influencing happiness have been conducted from various angles. Some (Praveen & Rani et al., 2016; Simon et al., 2005; Skevington, 2018) have looked at the stability of happiness and have found that social interaction and seeking new experiences are closely related to happiness. In addition there are studies (Sreedevi et al., 2016; Talkhabi et al., 2018; Wong et al., 2018) that have explored the complex relationship between income and happiness. Other studies (Yang & Choi, 2017; Yildirim et al., 2013; Yin, 2016) have shown that satisfaction with interpersonal relationships at age fifty can be used as an important indicator to predict health at age eighty. Relatedly, some studies (Kahneman et al., 1990; Catré et al., 2021) suggest that a happy marriage has a protective effect on mental health, and that people in stable relationships live longer and are happier. Meanwhile, Columbia University’s Center for Research in Sustainable Development supports three major research and policy projects on happiness and well-being. One of these is the World Happiness Report, which assesses the state of happiness around the world. The report ranks various countries according to how happy their citizens feel (https://worldhappiness.report/).
Some researchers (Feder et al., 2015;Gambin et al., 2015) have studied the correlation between wealth and happiness. They have found that although wealth is closely related to happiness in poor societies, the effect increasing wealth has on happiness gradually lessens. Additionally, it is argued that happiness is also influenced by cognitive patterns, and that positive cognitions (e.g. seeing opportunities, trusting and liking others) are important.
Despite the many studies that have been conducted on happiness, few have utilized large-scale data and advanced analysis technologies to provide a more accurate and empirical understanding of happiness. In particular, few studies have adopted an empirical approach to the factors of happiness by using methods such as big data analysis and topic modelling. Research conducted on happiness using these methods is able to identify complex influencing factors that cannot be identified using traditional research methods. Against this background, this study presents the following research questions:
1. What are the important factors raised by academic papers researching happiness?
2. Among the factors affecting happiness, which are particularly important?
METHODS
Analysis data
The analysis data for the first research question consists of research papers relating to happiness published in academic social science journals managed by Springer. Netminer 4.5, the software used in this study, is specifically linked to use papers from academic journals managed by this publishing company. Extracting the 1 000 most relevant papers from among those containing ‘happiness’ in the title, we use the abstracts of these papers as analysis data. By way of data for analysing the second research question, we use survey data from the Community Wellbeing Center at Seoul National University Graduate School of Public Administration in Korea. The survey in question was a survey on happiness conducted among 16 655 residents of 226 basic local authorities in Korea.
Analysis variables
As mentioned above, this study uses two main research methods, the data for the neural network analysis being survey data deriving from Seoul National University in Korea. The analysis variables to be used can be divided into dependent and independent variables. The dependent variable is ‘happiness level’, and the independent variables are variables related to happiness factors derived from the results of topic modelling analysis. All these variables are included in the survey items conducted by Seoul National University’s Graduate School of Public Administration. The survey’s questions are all structured on a ten-point scale, with 1 being the lowest and 10 the highest. The lower the score, the more negative, and the higher the score, the more positive. The survey questions on ‘level of happiness’ are presented in the following form:
· What do you think about the following? ① ‘strongly negative’ to ⑩ ‘strongly positive’.
· Please indicate your response number between ① and ⑩:
· I’m unhappy. ① ② ③ ④ ⑤ ⑥ ⑦ ⑧ ⑨ ⑩ I am happy
Analysis methods and procedures
As mentioned above, we use topic modelling analysis and neural network analysis as methods of analysing the first research question. Topic modelling is a statistical modelling technique used to discover hidden topic structures within documents or text data sets. This method assumes that each document in a document collection contains one or more ‘topics’, and these topics are expressed as a distribution of words. The aim of topic modelling is to identify these topics and determine how many of them exist in each document (Choi et al., 2023; Choi et al., 2021).
A representative algorithm for topic modelling is Latent Dirichlet Allocation (LDA). This assumes that each document and each topic follow a certain probability distribution, and through this it estimates the relationship between documents and topics. In order to reduce the number of topics derived in this way to a small number, machine learning techniques are used, in particular the Nonnegative Matrix Factorization (NNMF) method. This is one of the dimensionality-reduction techniques used in machine learning and data analysis. This method aims to decompose a given matrix of data into two smaller matrices; through this process, important structures or patterns within the data can be discovered (Choi, 2013).
To analyse the second research question, the Multi-Layer Perceptron (MLP) method among neural network analysis methods is used. Neural network analysis is a method of learning and predicting data patterns using an Artificial Neural Network (ANN). In this study, the Multi-Layer Perceptron method (MLP) was used during neural network analysis. This is the most basic form of artificial neural network, a feed-forward neural network that includes one or more hidden layers. In a feed-forward neural network, neurons in each layer receive input only from neurons in the previous layer and send output only to neurons in the next layer. If influencing factors related to happiness are extracted from the results of the first research question, it is possible on this basis to identify important influencing factors through neural network analysis.
Results
Basic analysis
First, for the topic modelling analysis, the keywords contained in 1 000 papers relating to happiness extracted from academic journals were examined through word cloud analysis, as shown in figure 1. The 1 000 papers extracted here include the word ‘happiness’ in their titles and represent the papers with the highest level of relevance.
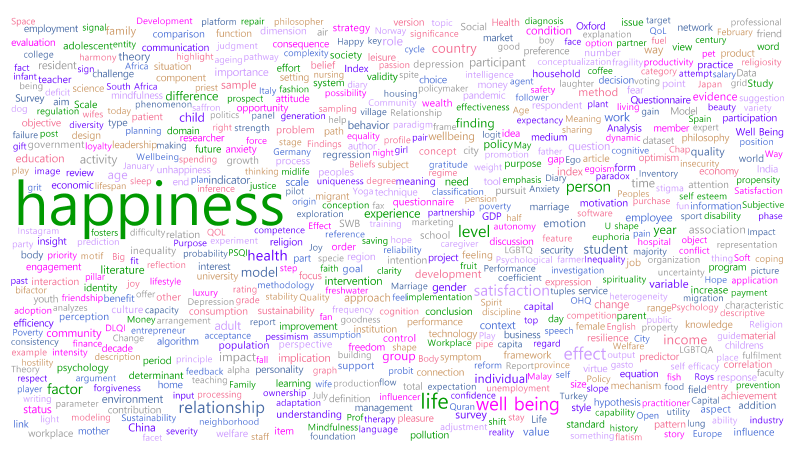
Figure 1. Word cloud analysis results
Figure 2 presents words included in the extracted papers in order of frequency of occurrence. Here, for analytical convenience, only the twenty-five words with the highest frequency of occurrence are presented as examples.
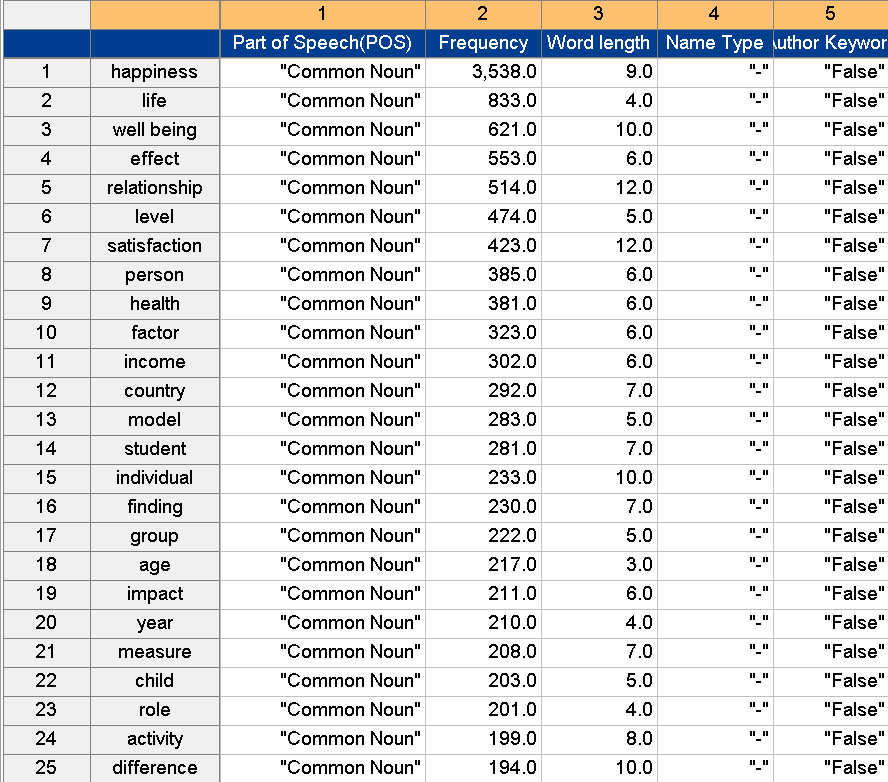
Figure 2. Frequency of extracted words
The word showing the highest frequency of occurrence is ‘happiness’, which appears 3 538 times, the next most frequent word being ‘life’, which appears 833 times. A word does not necessarily constitute a core network just because it shows a large number of occurrences, and its meaning may be emphasized or weakened in relationships with other words.
Topic modelling analysis
We then conducted a topic modelling analysis by referring to the word cloud analysis results and the frequency of occurrence of words in the basic data analysed above. What is important in topic modelling analysis is determining the number of topics and the number of words needed to compose one topic. To obtain information about this, we performed ‘coherence analysis’. This analysis relates to indicators that measure how semantically consistent the generated topics are. Since one of the main goals of topic modelling is to find meaningful topics, these consistency metrics are extremely important. In particular, the c_v value and u_mass value represent two ways of evaluating consistency.
By means of this analysis, we attempt to determine the appropriate number of topics and the number of words needed to form one topic. For this coherence analysis we used the functions of the Netminer 4.5 program. The results of the coherence test are shown in figure 3. When the c_v value is large and the u_mass value low, the number of topics is 10, and the alpha value at this time is 0,02 and the beta value 0,01. We will use this information to perform topic modelling.
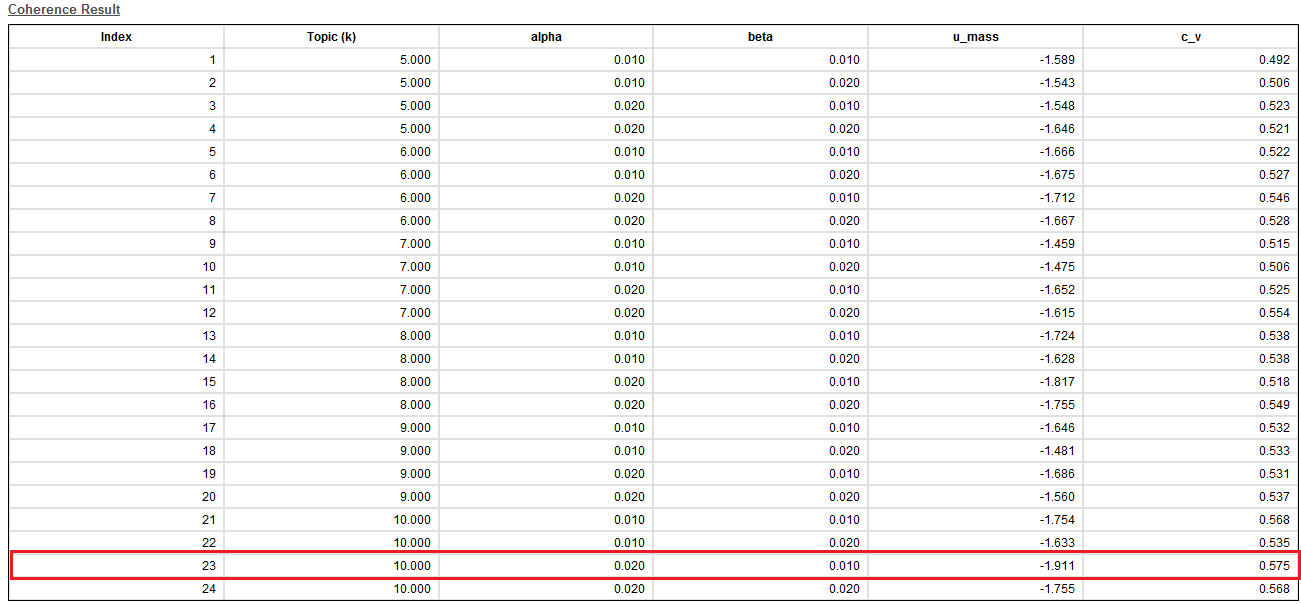
Figure 3. Coherence test results
Figure 4 shows the distribution form of u_mass coherence. U_mass coherence measures topic consistency based on the co-occurrence frequency of words in a document. This method calculates the probability that, given a specific word, other words will appear simultaneously. U_mass values are usually negative, with higher values being considered more consistent topics.
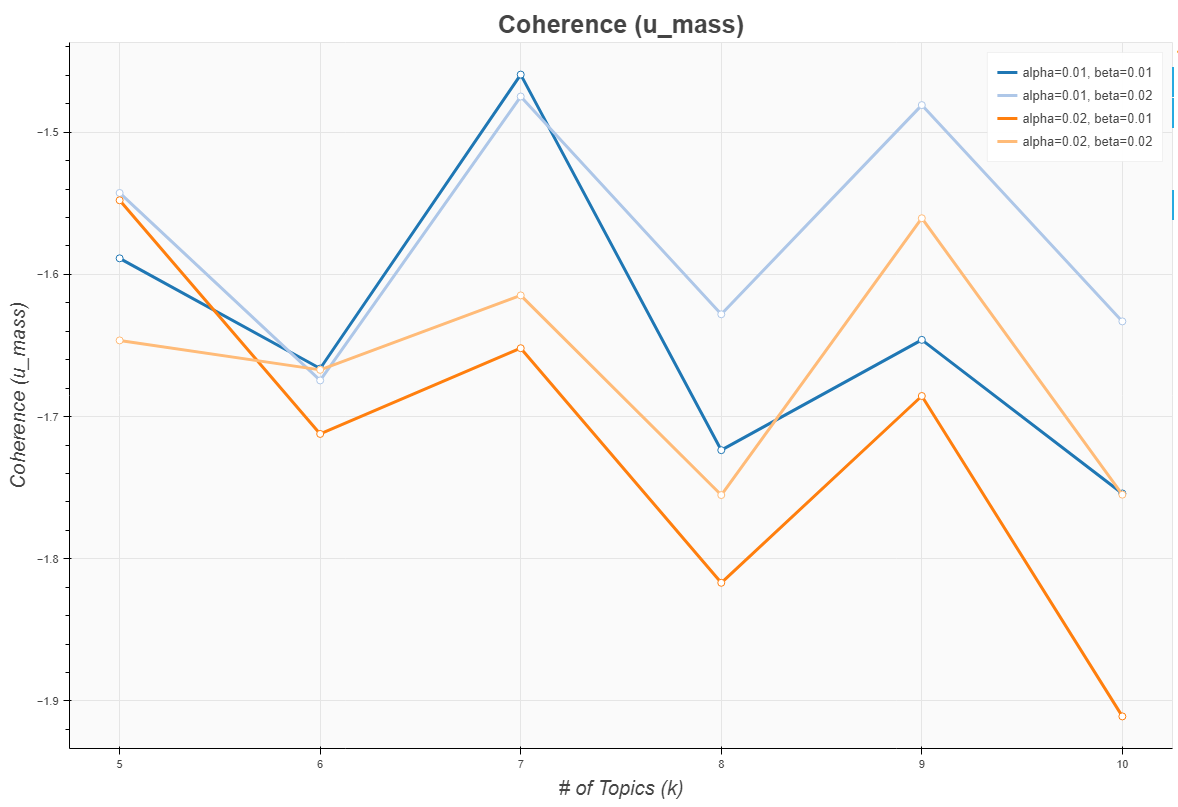
Figure 4. Coherence (u_mass)
Figure 5 shows the C_V Coherence value. The C_V value utilizes broader context information so as to take into account the co-occurrence frequency of each word pair and the similarity between them. In general, the higher the C_V value, the more semantically consistent the topic is considered to be. The C_V method is frequently used to evaluate the quality of topic modelling and is used as an important indicator for improving the performance of topic models.
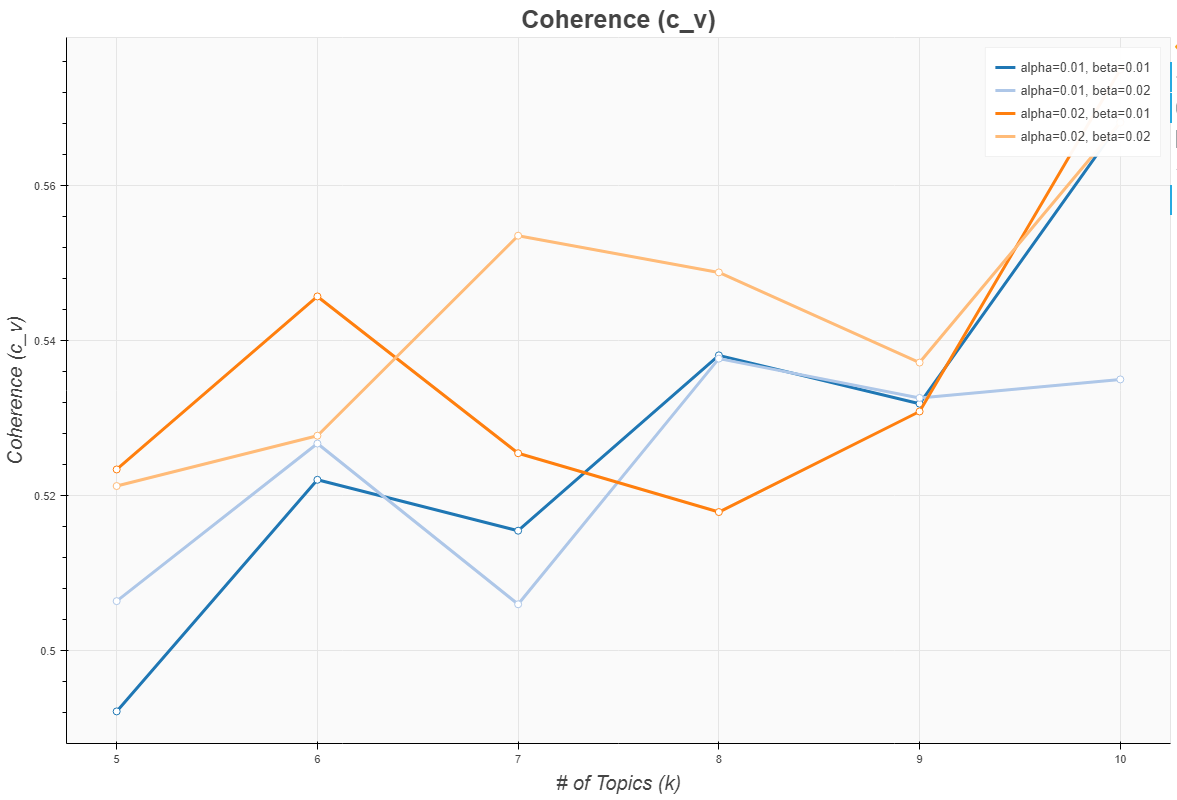
Figure 5. Coherence (c_v)
As figure 5 indicates, the appropriate number of topics is 10, and the alpha value at this time is 0,02 and the beta value 0,01. Meanwhile, the number of columns included in the topic was found to be 7. Topic modelling analysis was performed by supplying the conditions presented above to the Netminer 4.5 program. The ten topics derived through topic modelling analysis are shown in figure 6 below.
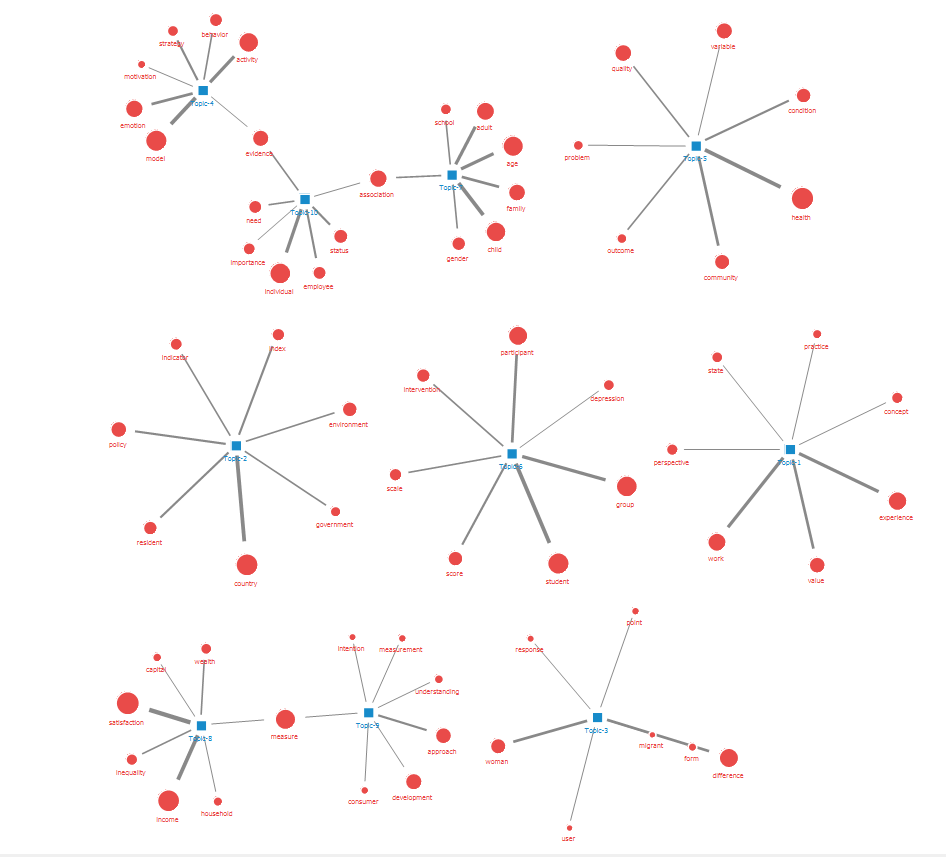
Figure 6. Topic modelling analysis results (ten topics)
As described above, the NNMF method, one of the machine learning methods, was used to reduce the ten topics derived here. As a result, the ten topics were reduced to five core factors, as shown in figure 7. The key factors condensed into five are presented in figures 7 to 11. (To distinguish each factor, a red line is used.)
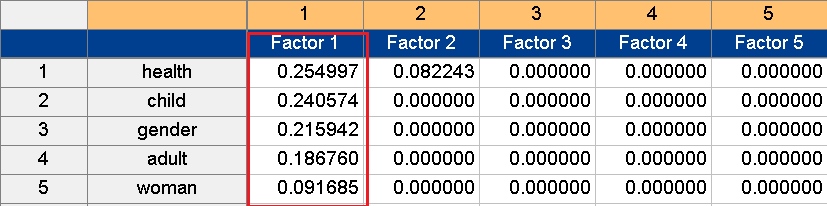
Figure 7. Factor 1: health factor
As figure 7 indicates, Factor 1 is related to the health of children, adults and women, and thus can be named the health factor. The higher residents’ level of satisfaction with their health was, the higher their level of perception of happiness. Meanwhile, Factor 2 (figure 8) can be named the income factor, judging from the characteristics of the composed variables. It may be assumed that the higher one’s income level, the higher one’s evaluation of one’s own level of happiness.
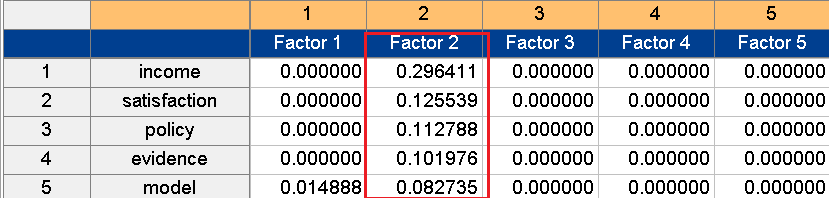
Figure 8. Factor 2: income factor
The case shown in figure 9 corresponds to Factor 3, which, judging from the nature of the constituent variables and the factor scores of the variables, can be named the family factor. It may be said that the higher the level of satisfaction with family relationships, the higher the level of awareness of one’s own happiness.
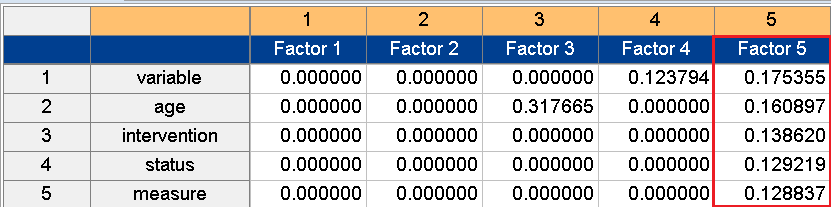
Figure 9. Factor 3: family factor
Meanwhile, figure 10 relates to Factor 4, which can be called the inequality factor. The lower the level of inequality within society, and the more people think that all members of society are living well, the higher their level of happiness will be.
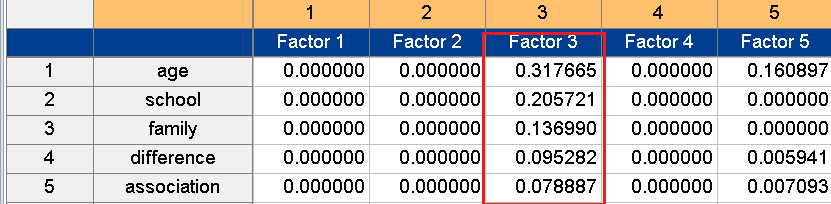
Figure 10. Factor 4: inequality factor
As figure 11 indicates, Factor 5 is related to level of satisfaction with one’s own social status. When one perceives one’s social status to be higher than that of others, one’s level of happiness increases. Therefore, Factor 5 can be named the social status factor.
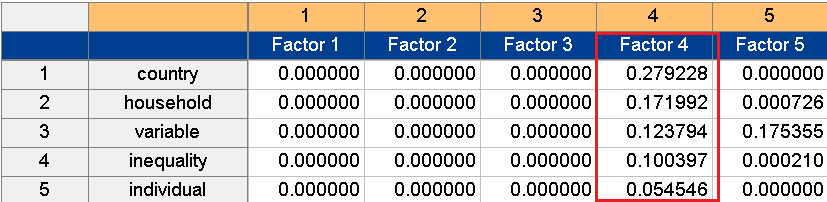
Figure 11. Factor 5: social status factor
As seen above, the ten topics that affect happiness can be reduced to five through machine learning techniques. These five condensed happiness factors are also meaningful as discoveries in themselves. However, we will perform neural network analysis to analyse which factors are particularly important among these five happiness factors.
Neural network analysis
Neural network analysis is a method of using artificial neural networks, inspired by the structure of the human brain, which allows multiple neurons (nodes) to connect to each other to perform complex calculations. Neural networks learn from data and use algorithms such as back propagation and gradient descent to optimize weights, resulting in high predictive and classification accuracy. Of these neural network analyses, this study utilizes the Multi Layer Perceptron (MLP) method. MLP is the most basic form of neural network and is a feed-forward neural network that includes one or more hidden layers. In this study, this method is used because MLP models identify well the various characteristics and complex structures of big data.
The dependent variable is level of happiness, and the independent variables are five: income, family life, social status, health, and perception of inequality.
Basic analysis
The analysis data included 16 655 pieces of data: training data of 11 571 pieces (69,9 %) and test data of 4 984 pieces (30,1 %). The standardization method was selected as a covariate adjustment method; the number of nodes in the input layer was five, the number of hidden layers was 1, and the number of nodes in hidden layer 1 was set to five. Hyperbolic tangent was used as the activation function in the hidden layer; the number of nodes in the output layer was 2, the softmax method was used as the activation function, and the cross-entropy method was used as the error function.
Figure 12 shows the neural network model derived from the neural network analysis.
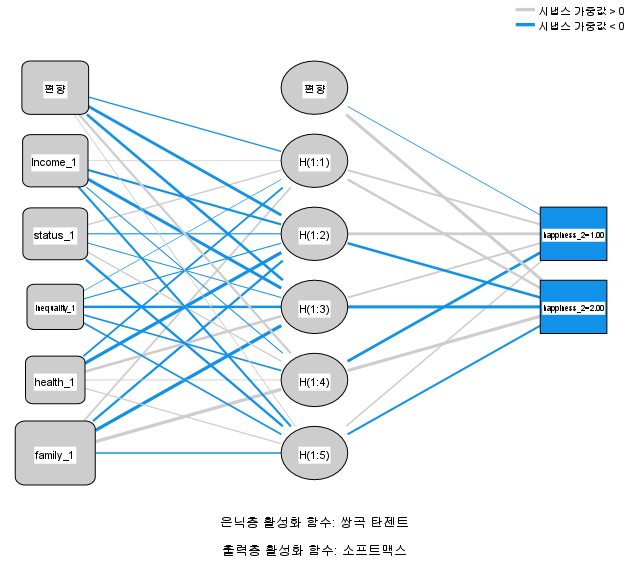
Figure 12. Neural network mode
As figure 12 indicates, hyperbolic tangent was used as the activation function in the hidden layer; the number of nodes in the output layer was 2, the softmax method was used as the activation function, and the cross-entropy method was used as the error function. The parts connected in bold indicate that the connection strength (synaptic weight value) is high. However, because the synaptic weight does not indicate the direct connection strength between the independent and the dependent variable, but a hidden layer exists between them, it cannot be said which independent variable has more influence on the dependent variable. In other words, since the diagram merely schematizes the structure of a simple neural network, it is used only for reference during analysis.
Figure 13 shows the results of parameter estimates. This parameter estimate in figure 13 calculates the connection strength between the independent variable and the hidden layer presented in the neural network structure diagram (figure 12), and the connection strength between the hidden layer and the output layer. These parameter estimates can include Weights and Biases values for each node (neuron) in the model, and these values show how the model learns data and makes predictions. In this parameter estimates, a weight with a high absolute value means that the variable has a large effect on the neuron’s activation. If the weight value is large and positive, this means that the input has a positive effect on activating the neuron. If the weight value is large and negative, that input will have a negative effect on activating the neuron. On the other hand, if the bias value is large, the neuron is activated more easily. This means that neurons can be activated with only a small input signal. However, when the bias value is small or negative, the neuron requires a stronger input signal to be activated.
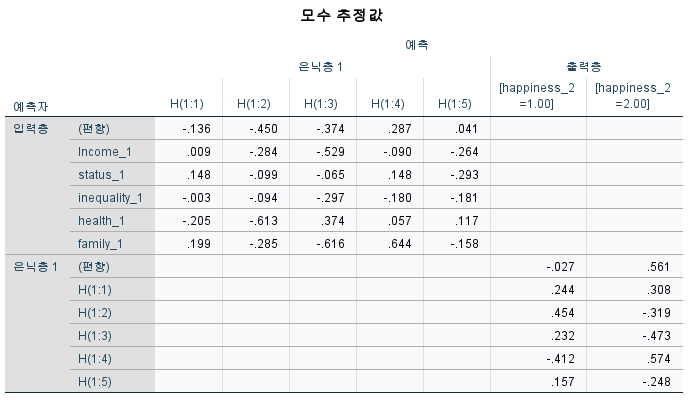
Figure 13. Parameter estimates
Figure 14 presents information on predictive similarity probability. This is a probabilistic measure that indicates how similar the prediction made by a neural network about data is to the actual value. This is a numerical expression of the reliability of each output or class when a neural network solves a classification or regression problem. Here, the probability value is generally expressed as a value between 0 and 1: 0 indicates that there is no possibility of that outcome, and 1 indicates that it will definitely occur. In classification problems, probability values for multiple classes are compared and the class with the highest probability is selected as the final prediction result. In the case of this study, the probability value is close to 0,7, meaning that the current model strongly predicts that the result will occur.
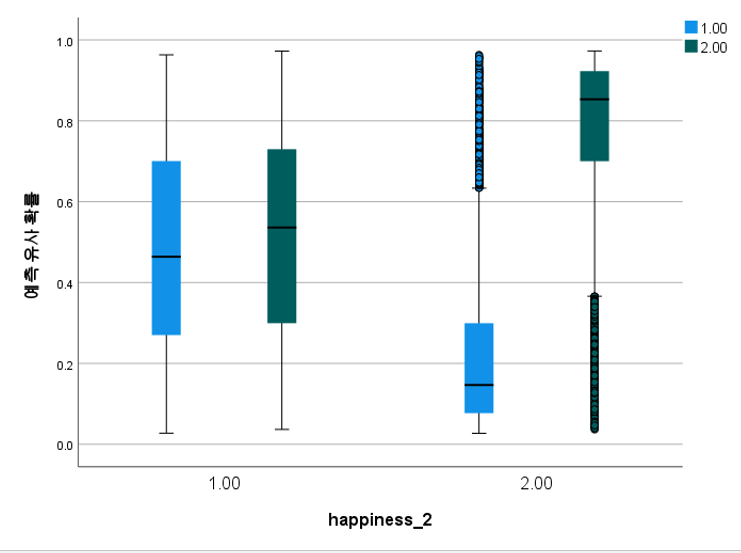
Figure 14. Predictive similarity probability
Figure 15 shows the Receiver Operating Characteristic (ROC) curve. This represents the relationship between sensitivity and 1-specificity (false positive rate). The latter is displayed on the X-axis and the former on the Y-axis. The larger the area under the curve (AUC), the better the model’s performance. The ideal model draws a ROC curve close to the Y-axis, and the AUC approaches 1. Here, sensitivity represents the rate of correctly predicting actual positive cases as positive, and specificity represents the rate of correctly predicting actual negative cases as negative. This figure is a graph with sensitivity and specificity displayed on the X and Y axes respectively. The ideal model is located at a point where both sensitivity and specificity are high. In the model used in this study, the AUC is 0,88, and it can be seen that it is located at a point where sensitivity and specificity are high.
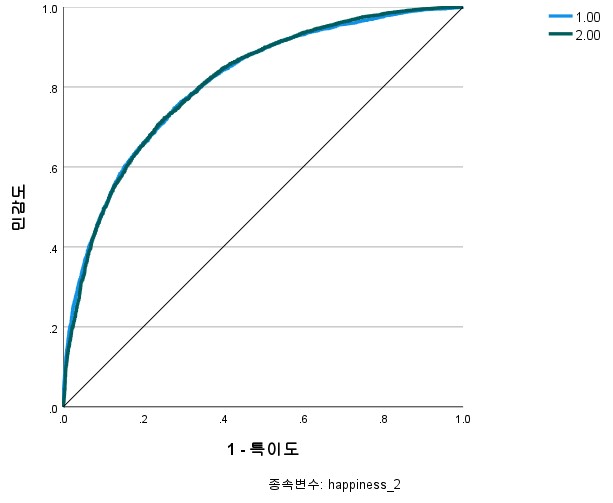
Figure 15. ROC curve (sensitivity and specificity)
Figure 16 shows the Cumulative Gain Chart. The purpose of this is to show how well the model identifies positive cases (e.g. high happiness levels). When interpreting the picture, the higher the curve is, the better the model’s performance. This indicates that the model is better at identifying positive cases among all cases. The baseline is usually drawn diagonally and represents a random selection in the absence of a model. The higher the actual model’s curve is above this baseline, the better the model is relative to random selection. In the case of the Cumulative Gain Chart presented in Figure 10, the model can be said to be excellent because its curve is much higher than the baseline.
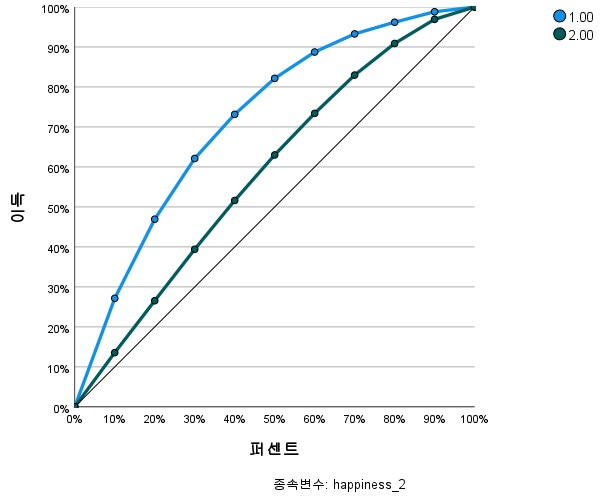
Figure 16. Cumulative Gain Chart
Figure 17 is a lift chart that presents information for evaluating model performance. A lift chart shows visually how much better a model is in providing predictions for a specific group. If the lift value is greater than 1, this means that the model performs better than random selection. For example, if the lift value is 2, the model will give results twice as good as those random selection gives. In an ideal lift chart the curve should peak towards the top left. This means that the model performs very well on the top per cent of data. The lift chart derived from this study shows a good performance.
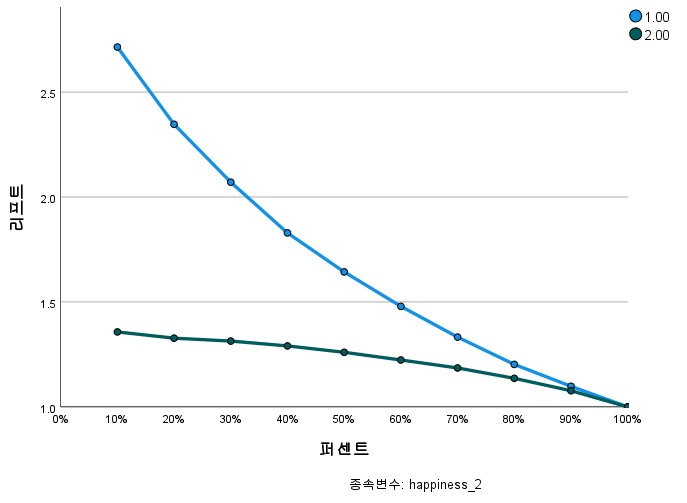
Figure 17. Lift chart
Figure 18 shows the importance of independent variables that affect level of happiness. Among the five variables, satisfaction with family life has the greatest influence on level of happiness, followed by social status, income and health status. It can be seen that awareness of inequality issues does not significantly affect level of happiness.
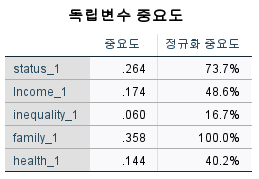
Figure 18. Importance of independent variables
Figure 19 presents the importance of independent variables graphically. It helps understanding of which variables the neural network model is giving more ‘weight’ to: that is, which variables have a greater impact on the results. Neural networks are often considered ‘black boxes’, but analysing variable importance can provide insights into how the model behaves.
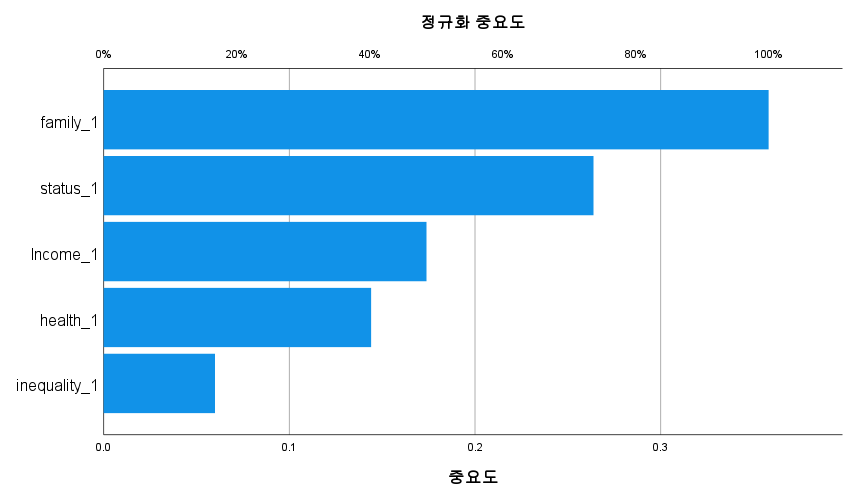
Figure 19. Importance of independent variables
CONCLUSION
This study analysed happiness-related research papers covered in international journals, and used topic modelling and machine learning techniques to derive important variables believed to affect happiness. The primary focus of this study has been on identifying the important variables that affect happiness via this process. The secondary purpose was to use data from a recent happiness-related survey in Korea to derive the variables that have the greatest impact on happiness and to identify their relative importance. For this purpose, neural network analysis was used. The study derived five primary happiness-related important variables: family life, income, social status, health, and perception of inequality. Essentially, it may be assumed that individuals’ levels of satisfaction with these five variables affect their overall level of happiness.
The five variables derived in this way were used as independent variables, and neural network analysis was performed with ‘happiness level’ as the dependent variable. This analysis showed that the variable that has the greatest impact on level of happiness is satisfaction with family life. The next most important variable is evaluation of one’s own social status, followed by income and health, with awareness of inequality appearing to be the least important. The implications of these results are as follows:
1. The importance that quality of family life has in relation to an individual’s psychological well-being offers important information for research on human behaviour and psychology. In particular, policies aimed at improving the quality of family life, such as supporting childcare, reducing working hours and promoting a family-friendly work culture, are becoming recognized as important, since such policies can ultimately contribute to increasing people’s happiness levels. In the future, local communities will be able to play an important role in improving the quality of family life. Community-based programmes or support may be needed for this.
2. The fact that family life and social status have a great influence on happiness in Korean society suggests the need for research that interprets this in cultural and social context. This could be expanded into international comparative research exploring how perceptions and values of happiness may differ in various social and cultural milieux. In addition, we believe that research analysing the impact of an individual’s social status on happiness is important for understanding social class, along with the pressure caused by rising status and the resulting psychological impact.
3. Policies are needed to reduce the social status gap, by equalizing education, employment and promotion opportunities and providing opportunities to increase social status. There is a pressing need to develop policies that can alleviate the problem of income inequality and improve the happiness levels and quality of life of all social classes through income redistribution, minimum wage increase, and expansion of public welfare programmes.
4. Policies are needed to improve public health and to ensure equal access to medical services for all social classes.
ACKNOWLEDGEMENTS
This work was supported by the Ministry of Education of the Republic of Korea and the National Research Foundation of Korea (NRF-2022S1A5C2A03092455).
REFERENCES
1. Abedi, G., Darvari, S. H., Nadighara, A., & Rostami, F. The relationship between quality of life and marriage satisfaction in infertile couples using path analysis. Journal of Mazandaran University of Medical Sciences. 2014;24(117):184–193.
2. Aghaei, A., Khayyamnekouei, Z., & Yousefy, A. General health prediction based on life orientation, quality of life, life satisfaction, and age. Procedia - Social and Behavioral Sciences. 2013;84:569–573.
3. Amazonas, I. T., Kawa, N. C., Zanetti, V., et al. Using rich pictures to model the ‘good life’ in indigenous communities of the tumucumaque complex in Brazilian Amazonia. Human Ecology. 2019;47:341–354.
4. Badiora, A. I., & Abiola, O. B. Quality of life (QoL) of rural dwellers in Nigeria: A subjective assessment of residents of Ikeji-Arakeji, Osun-State. Annals of Ecology and Environmental Science. 2017;1(1):69–75.
5. Catré, M. N. C., Ferreira, J. A., Catré, M. C., & Pereira, M. Development and application of a short-form questionnaire for assessing spiritual, religious, and personal beliefs related to quality of life (WHOQOL-SRPB-BREF) in Portugal. Applied Research in Quality of Life. 2021;16: 241–258.
6. Chen, K. Y., Li, T., Gong, F. H., Zhang, J. S., & Li, X. K. Predictors of health-related quality of life and influencing factors for COVID-19 patients, a follow-up at one month. Frontiers in Psychiatry. 2020;11:668.
7. Csikszentmihalyi, M. Flow: The Psychology of Optimal Experience. Harper & Row; 1990.
8. Darbanastaneh, A., & Mahmoudi, M. Assessment of the life quality in new Agropolitans case study: Banvareh in Kermanshah Province. Geography and Development Iranian Journal. 2016;14(42):199–218.
9. Di Castro, V. C., Hernandes, J. C., Mendonça, M. E., et al. Life satisfaction and positive and negative feelings of workers: A systematic review protocol. Systematic Reviews. 2018;7:243.
10. Diener, E., Suh, E. M., Lucas, R. E., & Smith, H. L. Subjective well-being: Three decades of progress. Psychological Bulletin. 1999;125(2):276-302.
11. Esmaeilpour, L., & Jafarjalal, E. The Association of the quality of work life and general health of the nurses in psychiatric wards. Iran Journal of Nursing. 2019;32(117):69–79.
12. Feder, K., Michaud, D. S., Keith, S. E., Voicescu, S. A., Marro, L., Than, J., … van den Berg, F. An assessment of quality of life using the WHOQOL-BREF among participants living in the vicinity of wind turbines. Environmental Research. 2015;142:227–238.
13. Fredrickson, B. L. Positivity: Top-Notch Research Reveals the Upward Spiral That Will Change Your Life. Crown; 2009.
14. Galenkamp, H., Braam, A. W., Huisman, M., & Deeg, D. J. Self-rated health: When and how to use it in studies among older people? International Handbook of Health Expectancies; 2020, p. 173–181.
15. Gambin, G., Molzahn, A., Fuhrmann, A. C., Morais, E. P., & Paskulin, L. Quality of life of older adults in rural southern Brazil. Our Remote Health. 2015;15:e3300.
16. Kahneman, D., Diener, E., & Schwarz, N. (Eds.). Well-Being: The Foundations of Hedonic Psychology. Russell Sage Foundation; 1999.
17. Lyubomirsky, S. The How of Happiness: A Scientific Approach to Getting the Life You Want. Penguin Press; 2007.
18. Maja, M. M., & Ayano, S. F. The impact of population growth on natural resources and farmers’ capacity to adapt to climate change in low-income countries. Earth Systems and Environment. 2021;5:271–283.
19. Pomeroy, I. M., Tennant, A., Mills, R. J., et al. The WHOQOL-BREF: A modern psychometric evaluation of its internal construct validity in people with multiple sclerosis. Quality of Life Research. 2020;29:1961–1972.
20. Praveen, V., & Rani, A. M. Quality of life among elderly in a rural area. International Journal of Community Medicine and Public Health. 2016;3:754–757.
21. Ryan, R. M., & Deci, E. L. On happiness and human potentials: A review of research on hedonic and eudaimonic well-being. Annual Review of Psychology. 2001;52:141-166.
22. Seligman, M. E. P. Authentic Happiness: Using the New Positive Psychology to Realize Your Potential for Lasting Fulfillment. Free Press; 2002.
23. Simon, J. G., De Boer, J. B., Joung, H., & Bosma, J. P. How is your health in general? A qualitative study on self-assessed health. European Journal of Public Health. 2005;15(2):200–208.
24. Skevington, S. M., & Epton, T. How will the sustainable development goals deliver changes in well-being? A systematic review and meta-analysis to investigate whether WHOQOL-BREF scores respond to change. BMJ Global Health. 2018;3:e000609.
25. Sreedevi, A., Cherkil, S., Kuttikattu, D. S., Kamalamma, L., & Oldenburg, B. Validation of WHOQOL-BREF in Malayalam and determinants of quality of life among people with type 2 diabetes in Kerala, India. Asia Pacific Journal of Public Health. 2016;28(1_suppl):S62–S69.
26. Talkhabi, H. R., Soleimani, M., Saeidnia, A., & Zanganeh, A. Metropolis explosion and sprawl of Tehran within the framework of urban decline theory. Geographical Urban Planning Research (GUPR). 2018;6(3):451–472. https://doi.org/10.22059/jurbangeo.2018.251153.859
27. Veenhoven, R. Conditions of Happiness. D. Reidel Publishing Company; 1984.
28. Wong, F. Y., Yang, L., Yuen, J. W. M., et al. Assessing quality of life using WHOQOL-BREF: A cross-sectional study on the association between quality of life and neighborhood Environmental satisfaction, and the mediating effect of health-related behaviors. BMC Public Health. 2018;18:e1113.
29. Yang, Y., Bekemeier, B., & Choi, J. Health-related quality of life and related factors among rural residents in Cambodia. Iran J Pub Health. 2017;46(3):422–424.
30. Yildirim, Y., Kilic, S. P., & Akyol, A. D. Relationship between life satisfaction and quality of life in Turkish nursing school students. Nursing & Health Sciences. 2013;15(4):415–422.
31. Yin, S., Njai, R., Barker, L., Siegel, P. Z., & Liao, Y. Summarizing health-related quality of life (HRQOL): Development and testing of a one-factor model. Population Health Metrics. 2016;4,:22.
32. https://worldhappiness.report
FINANCING
This work was supported by the Ministry of Education of the Republic of Korea and the National Research Foundation of Korea (NRF-2022S1A5C2A03092455).
CONFLICT OF INTEREST
The authors declare that there is no conflict of interest.
AUTHORSHIP CONTRIBUTION
Conceptualization: Ji-Hyun Jang.
Research design: Ji-Hyun Jang.
Analysis: Ji-Hyun Jang.
Drafting: Ji-Hyun Jang.
Writing: Ji-Hyun Jang.
Data Collection: Masatsugu Nemoto.
Proofreading: Masatsugu Nemoto.