doi: 10.56294/dm2024.367
ORIGINAL
Automated Analysis Of Diabetic Vasculopathy Using Semantic Segmentation Of Thermal Images Of Peroneal Vessel
Análisis Automatizado De Vasculopatía Diabética Mediante Segmentación Semántica De Imágenes Térmicas De Vasos Peroneus
Gayatri Joshi1 ![]() *, Punal M Arabi2
*, Punal M Arabi2 ![]() *
*
1Research scholar, Department of Biomedical Engineering, ACS college of Engineering, Bengaluru.
2Professor, Department of Biomedical Engineering, ACS College of Engineering, Bengaluru.
Cite as: Joshi G, Arabi PM. Automated Analysis Of Diabetic Vasculopathy Using Semantic Segmentation Of Thermal Images Of Peroneal Vessel. Data and Metadata. 2024; 3:.367. https://doi.org/10.56294/dm2024.367
Submitted: 26-01-2024 Revised: 19-04-2024 Accepted: 31-08-2024 Published: 01-09-2024
Editor: Adrián
Alejandro Vitón-Castillo ![]()
Corresponding author: Gayatri Joshi *
ABSTRACT
Introduction: diabetic vascular disease is one of most serious health problems in diabetic patients, it causes the development of severe complications including delayed wound healing and increased susceptibility to infections.
Method: to provide accurate and are non-invasive diagnosis, current work emphasizes on Diabetic Vasculopathy (DV) that is analysed with thermoregulation images through Semantic Segmentation (SS). A novel methodology was adapted, combining thermoregulation imaging with SS using the U-Net++ model to investigate temperature distributions at the skin level. This work introduces a novel method that utilizes MobileNetV2 as the encoder for fast Feature Extraction (FE).
Results: the results from the suggested model, achieves a segmentation accuracy of 95 %, which is significantly more compared to that of DeepLabV3+ and PSPNet models. A mean and Intersection over Union (IoU) of 85 % and 87 % was reported by the suggested frameworks throughout the training and validation phases.
Conclusion: classifying normal and abnormal regions can be done via the outcomes, as it offers the great visibility in the thermal image for clinicians by detecting the non-thermal regions.
Keywords: Diabetic Vasculopathy (DV); Semantic Segmentation (SS); Thermoregulation Imaging; Unet++; MobileNetV2; Deep Learning (DL).
RESUMEN
Introducción: la enfermedad vascular diabética es uno de los problemas de salud más graves en los pacientes diabéticos, provoca el desarrollo de complicaciones graves que incluyen retraso en la cicatrización de heridas y aumento de la susceptibilidad a infecciones.
Método: para proporcionar un diagnóstico preciso y no invasivo, el trabajo actual enfatiza en la Vasculopatía Diabética (VD) que se analiza con imágenes de termorregulación a través de Segmentación Semántica (SS). Se adaptó una metodología novedosa que combina imágenes de termorregulación con SS utilizando el modelo U-Net++ para investigar las distribuciones de temperatura a nivel de la piel. Este trabajo presenta un método novedoso que utiliza MobileNetV2 como codificador para una rápida extracción de características (FE).
Resultados: los resultados del modelo sugerido logran una precisión de segmentación del 95 %, que es significativamente mayor en comparación con la de los modelos DeepLabV3+ y PSPNet. Los marcos sugeridos informaron una media y una intersección sobre la unión (IoU) del 85 % y el 87 % a lo largo de las fases de capacitación y validación.
Conclusión: la clasificación de las regiones normales y anormales se puede realizar a través de los resultados, ya que ofrece una gran visibilidad en la imagen térmica para los médicos al detectar las regiones no térmicas.
Palabras clave: Vasculopatía Diabética (DV); Segmentación Semántica (SS); Imágenes de Termorregulación; Unet++; MobileNetV2; Aprendizaje Profundo (DL).
INTRODUCTION
Diabetes-related vascular problems, that affects both the microvascular and macro vascular systems are known as DV.(1) This disease will affect individuals involving signs like slowed wound healing, elevated infection risk and finally leads to loss of limbs. These are the severe issues caused by this disease. Surface temperature distribution of the skin was analyzed by non-invasive method as thermoregulation imaging. This method also provides the data regarding the state of Blood Vessels (BV) and blood flow. Vascular abnormalities can be accurately detected as the Region of Interest (ROI) and classified via the SS and DL (Deep Learning).(2)
In-depth thermal patterns and vascular condition analyses can be attained via the SS. It also supports in the detection of DV by providing every pixel in an image a specific label.
Early medical care is necessary for the diabetic patients for minimizing the severe risks. Thus, analysing DV via thermoregulation imaging is crucial. For visualizing temperature variations on the skin corresponds to the blood flow and vascular health, a non-invasive, safe, and effective technique was offered by the thermoregulation imaging.(3) Regions with poor blood circulation can be detected earlier via imaging techniques for preventing severe risks like ulcers and gangrene. Thus, early detection of the suspectible risks will helps in preventing such severe complications. Improvements of patient outcomes and quality of life is attained by the continual monitoring as it supports for effective treatment and treatment modifications using thermoregulation imaging.(4) Through reducing the risk of progressive vascular risks, this technique also reduces the medical expenses thereby reduces the demand for the invasive diagnostic process.
Utilizing thermoregulation imaging, the analysis of DV employs a range of methods from advanced automated techniques to manual interpretation.(5) Then an inaccurate and laborious tasks occurs when clinicians assessing the thermoregulation images manually. For the purpose of enhancing efficacy and accuracy, the automated methods are presented due to the advancements in the Machine Learning (ML) and DL. For the automatic segment and classifying various regions in the thermoregulation imaging, the SS frameworks like U-Net and its variants are widely employed.
For the purpose of recognizing patterns indicating vascular abnormalities, these frameworks are trained on a large dataset of annotated images. For the accurate segmentation of normal and abnormal regions, the application of DL supports in the complicated FE in the images.(6) Then, the adaptive pre-trained models to the particular task of analysing thermoregulation imaging involved in the Transfer Learning (TL). It also enhances the potential in attaining superior performance with sparse data. More accurate, unbiased, and scalable analysis of DV was enabled by these techniques.
There is a need for addressing several research gaps and challenges despite the advancements in DV analysis via thermoregulation imaging.(7) The lack of extensive, annotated datasets for the diabetic patient’s thermoregulation imaging is a major problem. In robust DL techniques, these datasets are important for training and validation. Then, consistency and reliability of the segmentation outcomes gets impacted by the variability in imaging applications like variations in the surrounding temperature and patient locations. A more comprehensive analysis of vascular health attained by integrating thermoregulation imaging with other diagnostic models including UltraSound (US)or MRI as the current methods also emphasis single-modality analysis.(8)
Furthermore, the real-time application and clinical validation of these techniques remain underdeveloped. Most studies are conducted in controlled environments, and their translation to routine clinical practice requires further research and adaptation. Addressing these gaps will be essential for improving the effectiveness and adoption of thermoregulation imaging and semantic segmentation in managing diabetic vasculopathy.
Literature survey
Cesar A. Salazar et al.(9) outlined the advantages of employing thermography as a potential clinical diagnostic tool for DF based on a thorough literature evaluation conducted by the BASPI-FootLab research group over the last 15 years. This study reports on preliminary findings from our review. The vascular system (VS), peripheral vascular system (PVS), central nervous system (CNS), and peripheral nervous system (PNS) are the physiological systems that are impacted by type 2 diabetes mellitus (DM2). Complications affecting the PVS and PNS are commonly referred to as diabetic vasculopathy (DV) and diabetic neuropathy (DN), respectively. The two most significant physiopathologies associated with DN and DV that have been documented on the foot are heat and hypoesthesia. These issues result in the plantar surface losing its sensitivity and becoming hotter, respectively. If pressure is applied repeatedly, these issues might lead to an ischemia or inflammatory issue.
Andrés Anaya-Isaza et al.(10) suggested examining three cutting-edge deep learning (DL) architectures and utilizing convolutional, residual, and attention (Transformers) techniques to categorize individuals with diabetes mellitus from pictures obtained through diabetic foot thermography. Three different scenarios of data augmentation were used to train the models. The first study to achieve this synergy in the characterization of risk in ulcers using thermographies is a unique approach based on altering the pictures through the modification of the amplitude in the Fourier Transform.
Álvaro Astasio-Picado et al.(11) examined the application of infrared thermography and the differences in foot temperature between individuals with and without diabetes by dividing the foot’s sole into four study regions. A suggested cross-sectional research included 479 participants, split into two groups: those with diabetes and individuals without the disease.
Vincent Serantoni et al.(12) examined the relationship between impaired thermoregulatory systems and diabetic peripheral neuropathy utilizing spectral thermal analysis, a thermal camera, and a physical test. After six minutes of walking, a thermal camera was used to take each participant’s plantar skin temperature. Following frequency decomposition of the data, two frequency ranges relating to endothelium and neurogenic pathways were identified. Then, for every participant, 40 thermal markers were assessed. The identification of markers capable of detecting the presence or absence of diabetic peripheral neuropathy was made possible using statistical testing and the ROC curve.
Punal M Arabi et al.(13) examined the blood vessel thermoregulatory behaviour in individuals with and without diabetes to comprehend the alterations in thermoregulation brought on by the disease and how it improves with time. Diabetic vasculopathy is a condition that is more likely to occur in those with diabetes if their disease is not effectively managed. The thermoregulatory activity of peroneal BV are assessed for detecting vascular abnormalities in the suggested work.
For preserving the integrity of diabetic foot tissue, a theory was presented by Yijie Duan et al.(14), as it controls foot temperature and steady rise in temperature was avoided by walking. The DFUs frequency can be reduced by implementing this technique. By the tissue metabolism, and biomechanical features, the clinical randomized controlled analysis analyzes the concept. A unique security against DFUs and development of foot assistance can be emphasized by the research and it is considered to be the main objective of this work.
Oktay Fasihi-Shirehjini et al.(15) evaluated ConvNeXt versions’ effectiveness in automatically identifying diabetic foot using thermal imagery. Plantar thermal pictures of both non-diabetic and diabetic patients are included in the collection. The features extracted by ImageNet pre-trained ConvNeXts were used to classify thermal images using Fully Connected (FC) layers, Support Vector Machine (SVM), and Logistic Regression (LR) following pre-processing and data augmentation using standard methods or fancy Principal Component Analysis (PCA).
Victoria A. Cornelius et al.(16) focused on what is currently known about alternative splicing and the functions of isoforms that have an alternative splice within the vasculature, with an emphasis on disease conditions. Additionally, we discuss the new discovery of the alternatively spliced QKI gene in relation to the physiology of vascular cells and the development of diabetic vasculopathy. We also address possible therapeutic approaches to correct faulty splicing.
METHOD
In this research work, a novel method is introduced and proposed to solve the problem of accurate and effective detection and analysis of Diabetic Vasculopathy posed by thermal images of thermoregulation using the U-net++ semantic segmentation model, with improvements to the MobileNetV2 of the encoder. Workflow graph of the proposed model is depicted in figure 1.

Figure 1. Proposed work flow
Steps for Analyzing Diabetic Vasculopathy Using Semantic Segmentation of Thermoregulation Images
Read the Input Image
Through the thermal imaging technology, the loading of thermoregulation image was captured and it is considered to be the initial phase. The underlying blood flow and vascular health is revealed by this image, as it indicates the temperature variations on the skin surface. Then, for the purpose of detecting DV, the HR (High Resolution) images are essential. These HR images offers detailed thermal data. Then the images are pre-processed for eliminating the noise and aircrafts and also ensures accuracy for additional investigations.
Extract the Region of Interest (RoI) Using Unet++ Semantic Segmentation
For the purpose of detecting and segmenting the ROI in the thermoregulation image, the Unet++ is applied. Differentiating the normal tissue and vascular abnormalities area by segment Unet++ and labelling every pixel. The specific areas with DV thermal patterns is focussed by the precise segmentation. It is crucial for additional study.
Identify the Center Position of the Image and Construct a Bounding Box
Constructing a bounding box around the ROI to determine the central position after segmentation. The ROI is surrounded by the rectangular framework, it also emphasis on further study in the particular segment of the image. Accurate positioning of the bounding box that is constructed for covering all the pertinent data and also eliminating unrelated segments are ensured by computing the centroid of the segmented regions.
Extract the Image Region Inside the Bounding Box
At last, Cropping the image for obtaining the pixel data within the bounding box. Through segmenting the specific ROI, this stage reduces the computational load and facilitates additional study. When eliminating additional data, the comprehensive analysis of vascular abnormalities related to DV was allowed by focusing on cropped region and the precision and visibility can be enhanced by focusing cropped region.
Proposed Unet++
SS labels every pixel in an image and is considered to be the main objective of the basic Computer Vision problem. Accurate Object Detection (OD) and classification in an image are made possible by this suggested appraoch and it is crucial for MI (Medical Imaging), autonomous vehicles and image analysis (IA).
The accuracy of the segmentation tasks is enhanced by the Unet++ framework, it is a complicated version of the original U-Net structure. Segmentation efficiency and computational efficiency are the issues of U-Net, as it can be efficiently addressed by the suggested Unet++. Enhancing the Feature propagation, gradient flow by the series of nested skip pathways and dense skip pathways are presented by Unet++, finally it will result in more accurate segmentations.

Figure 2. Unet++ architecture
MobileNetV2 as Encoder
Condensing and extracting features from the input image is a crucial function of the encoder in Unet++. Because MobileNetV2 maintains an equilibrium among efficiency and performance, especially in contexts with limited resources, it was an appropriate decision for the encoder.
Encoder has the following main aspects:
Depthwise Separable Convolutions (DSC)
By splitting conventional convolutions into 2 phases, DSC in MobileNetV2 increase efficiency. A single filter was primarily implemented to every input channel by the depthwise convolution, as the spatial features are greatly emphasized and reducing the computational load considerably. Utilizing the pointwise convolution(1x1), the outputs are combined across the channels. These pointwise convolutions classify the inter-channel relationships. Due to the segmentation, the ability in learning complicated features with less resourses by MobileNetV2. The amount of parameters and computations can be significantly reduced as a result of this.
Inverted Residuals (IR) with Linear Bottlenecks (LB)
The enhancement of structure of MobileNetV2, and improvements in efficiency can be attained by the IR with LB. The IR block broadens the channels and applying depthwise convolutions and compressing channels for capturing the rich data when compressing images. Preserving significant data and eliminating the redundant non-linear activations are then monitored by LB. A balance among model complexity and performance by the robust and light-weight network was created by this method.
Efficient Feature Extraction
MobileNetV2 extracts features efficient with efficiency due to its adaptive scaling and hierarchical structure. Then, the images are processed in stages, it captures complex HL (High Level) features in the deeper layers and LL (Low Level) features like the edges in the initial layers. DownSampling (DS) methods reduces the memory utilization and focussing the computational level on relevant features through reducing the spatial dimensions of (FM) Feature Maps. Additionally, MobileNetV2 scalable architecture allows for modification for a range of applications without reducing the computational efficiency or accuracy.
Unet++ as Decoder
Using the encoder’s compressed feature images, Unet++’s decoder rebuilds the high-resolution segmentation map. The nested and dense skip connections added by the Unet++ decoder improve upon the original U-Net architecture. The model can accurately represent spatial data as well as fine-grained features due to these modification.
Decoder has the following main aspects:
Nested Skip Pathways
While the direct skip connections in the original U-Net, nested skip pathways in Unet++ use numerous intermediate Convolutional Layers (CL) to improve the transmission of data among the encoder and decoder. As features move through several processing steps, this intricate structure enables progressive feature enhancement. This will lead to the comprehensive and complex integration of data, as it significantly enhances the capacity of the model for collecting the data. It will also enhance the boundaries, fine-grained features in the segmentation map.
Dense Connectivity
For enhancing the gradient flow and feature propagation across the network, the dense connectivity is combined with Unet++. Every layer is impacted by every level that comes prior in the block, in addition to the one that preceeds it. This structure makes it possible to continuously utilize features and maintaining network that is widely accessible to the crucial data. More comprehensive and effective learning was facilitated by preventing Vanishing Gradient Problem (VGP). For precise image analysis, the comprehensive and robust segmentation can be attained by Unet++.
Multi-Scale Feature Aggregation (MSFA)
An effective tool for MSFA is Unet++. It integrates features from different resolution levels. This feature is vital for accurate OD with different size and shapes, as it allows the framework that combines the local feature and broad contextual data. Capturing the small data and broad framework by this aggregation, as it is created by the Nested connections and dense connections of Unet++. Unet++ is an effective method for applications demanding the fine-grained segmentation due to its potential of accurately segmenting complicated objects and delimiting boundaries.
RESULTS
The efficiency of the research is heavily relying on the application of thermal images as an input in the outcomes of the experiment. Novel perspective on the objects or events captured by the thermal images. It also emphasizes various ROI with their own thermal signs. There is a lot of thermal-related data on the images. Differentiating among the various regions in the segments by these images. It also acts as a basis for the segmentation task.
The final outcome of the segmentation procedure is represented by these masks, which accurately define the target objects or areas inside the thermal images. The input thermal images and their matching masks are shown in figure 3. Through the specific labelling or ground truth annotations, the masks are produced. It also acts as an essential benchmark for assessing the models of the accuracy.

Figure 3. Input images and masks
For training and validating the Unet++ SS framework, the monitoring loss is crucial. This process helps in determining the rate at which the novel data collection by the framework and the way it extends effectively over the previous data. During training, the actual ground truth labels are compared with the segmentation masks that is generated by the algorithm. By the training loss, the variations among the suggested masks and true labels is assessed. This loss indicates the rate at which the framework process novel data and is evaluated at all phase of the training. The ideal outcome is to reduce training loss over time, it demonstrates that the framework is improving at matching real data to prediction. When the training loss consistently reduces, the algorithm is effectively capturing the patterns needed for accurate segmentation.
Constantly monitoring the validation loss is also crucial. This loss corresponds to the model observed throughout the training. Alternatively, it is calculated using different validation dataset. This test verifies that the framework is not only learn the training set by assessing the extent to which it generalizes to untested, novel events. Emphasizes the extent of the framework that learns novel data by the analysis of the validation loss. As a result of overfitting, it is significant to balance both metrics, it indicates that there is a probability for differentiating the training and validation loss. An overfitting that occurs when the framework performs effectively on the training data and it executes ineffectively on the novel data.
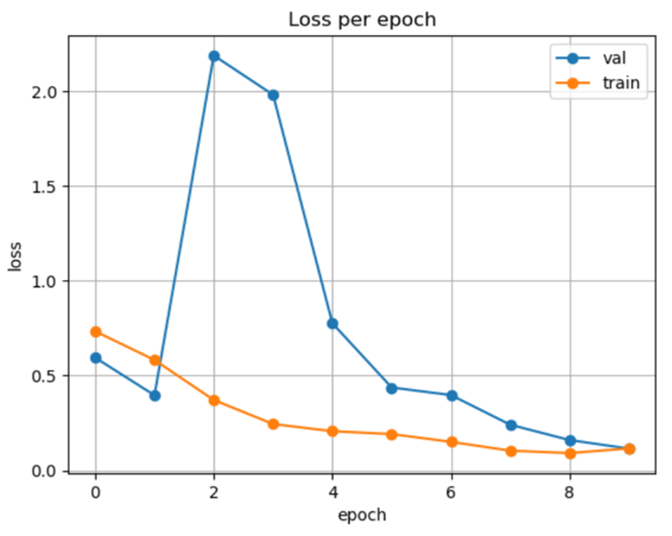
Figure 4. Training and validation loss
Mean Intersection over Union (IoU) is an essential metric for assessing the Unet++ model’s effectiveness in SS tasks during the training and validation stages. It measures the manner in which the model differentiates and segments different features within images by analyzing the relationship that exists between predicted segmentation masks and the ground truth annotations. Throughout training, mean IoU is continuously computed on the training dataset for offering real-time feedback on performance to the model.
This metric helps in determining the degree that split regions, that match the predictions of the model. A higher Mean IoU indicates improved model performance, as evidenced by a more accurate match between the predicted and true regions. An increased Mean IoU value during the course of training typically denotes an improvement in the model’s ability to accurately recognize and segment different objects or regions in the images.
As mean IoU assesses the model’s ability to generalize to new, untested data, it remains significant during the validation phase. The model is constructed using a distinct validation dataset to ensure that its segmentation capabilities are not just restricted to the training data but also capable of applying effectively to a range of datasets. A high Mean IoU on the validation set, which also demonstrates the model’s accuracy as well as validity in feature segmentation over a variety of data, is indicative of the model’s effectiveness in real-world applications.
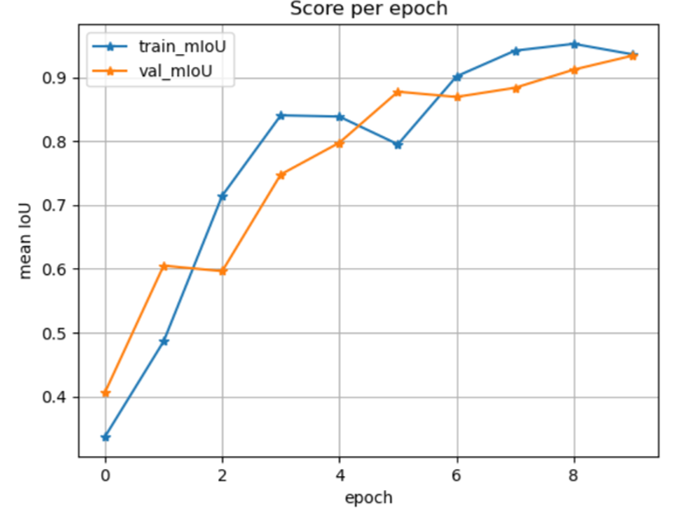
Figure 5. Training and validation mean IoU
For the purpose of evaluating an Unet++ model’s effectiveness for SS throughout training and validation, accuracy monitoring is crucial. By comparing the segmentation masks that the framework predicts with the actual ground truth annotations on the training dataset, accuracy is determined throughout the training process.
By comparing the percentage of accurately detected pixels, this comparison shows the degree to which the algorithm is learning to match its predictions to the real data. The model appears to be improving at capturing and detecting the important elements in images based on the training accuracy increases that have been observed over time.
Validation accuracy, on the other hand, is calculated using a separate dataset that was not used during training. This metric assesses the model’s ability to apply its learned segmentation capabilities to new, unseen data. It essentially tests how well the model can generalize its learning beyond the training dataset, providing insight into its performance in real-world scenarios.
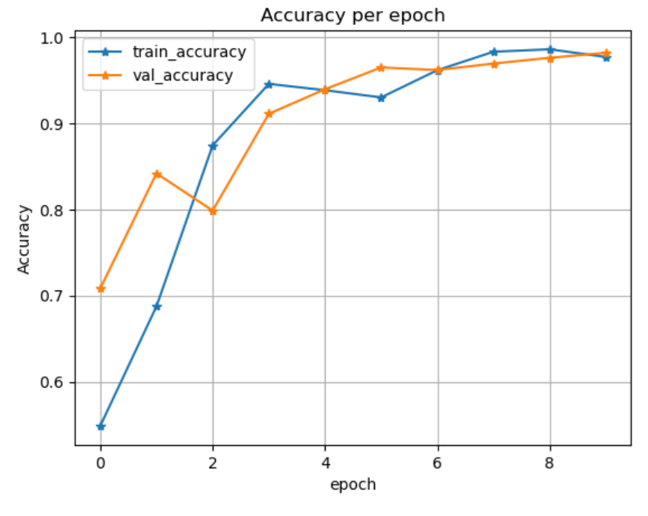
Figure 6. Training and validation accuracy
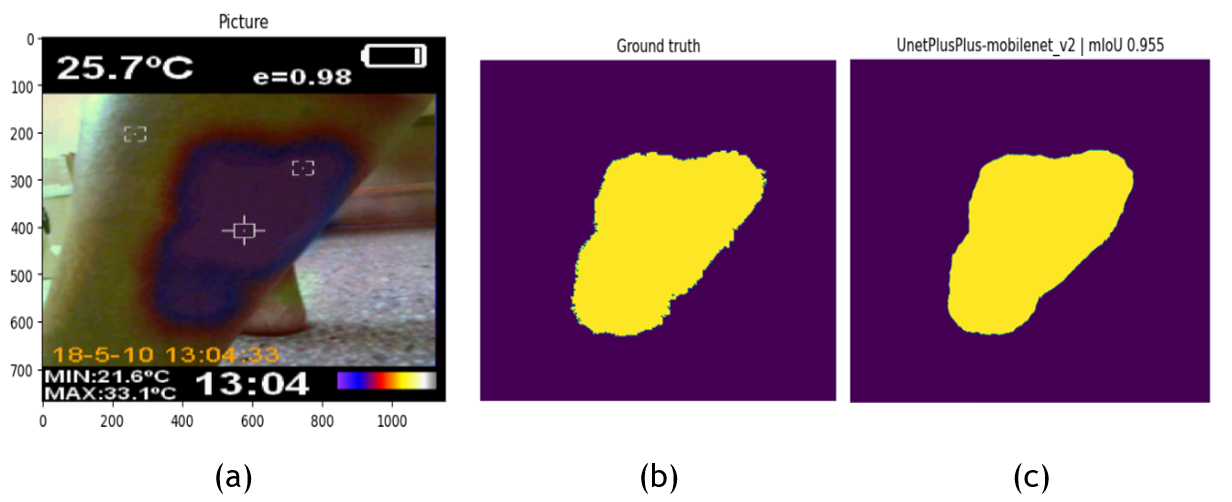
Figure 7. RoI extraction
The extracted ROI from the input photos is displayed in figure 7. The input image is displayed in the first image, figure 7(a). Figure 7(b), the second picture, displays the ground truth image, whereas Figure 7(c), the third image, displays the extracted image.

(a) diabetic_less_than_10yrs patient 1
(b) diabetic_less_than_10yrs patient 2
(c) Neuropathic patient 1

(d) Neuropathic patient 2
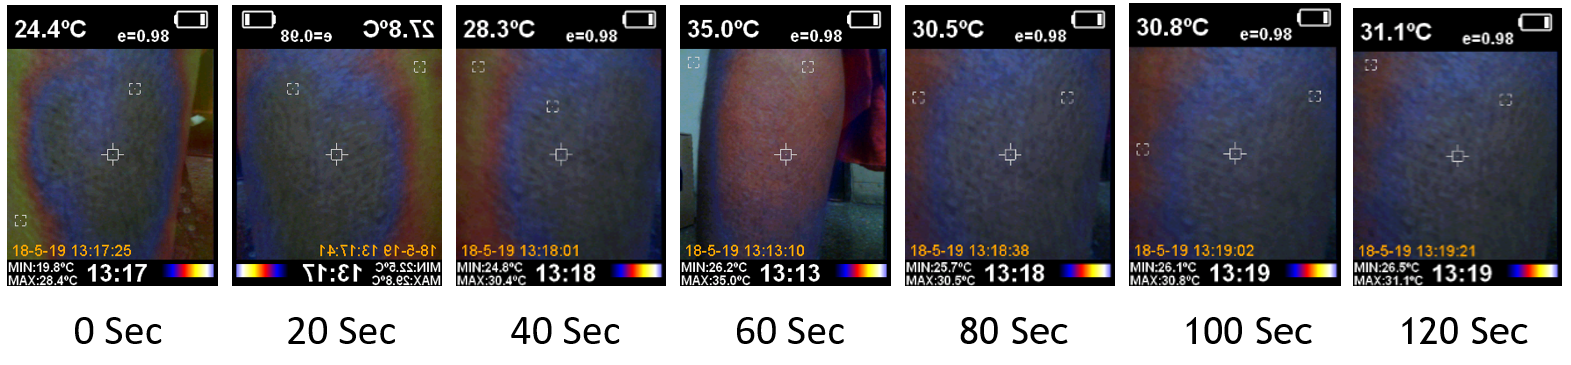
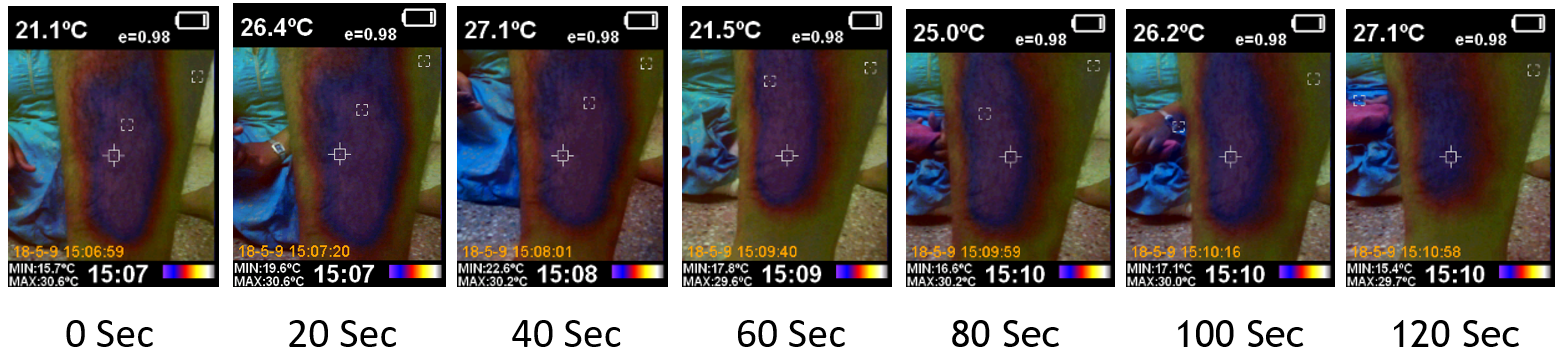
Figure 8. Cold stress images
The patients’ images under cold stress are displayed in figure 8. The pictures (a) and (b) depict the photos of patients 1 and 2, diabetic less than 10 years old, and were taken at intervals of 0, 20, 40, 60, 80, 100, and 120 seconds, respectively. Pictures (c) and (d) depict the neuropathic patient photos of 1 and 2, obtained at intervals of 0 seconds, 20 seconds, 40 seconds, 60 seconds, 80 seconds, 100 seconds, and 120 seconds, respectively.
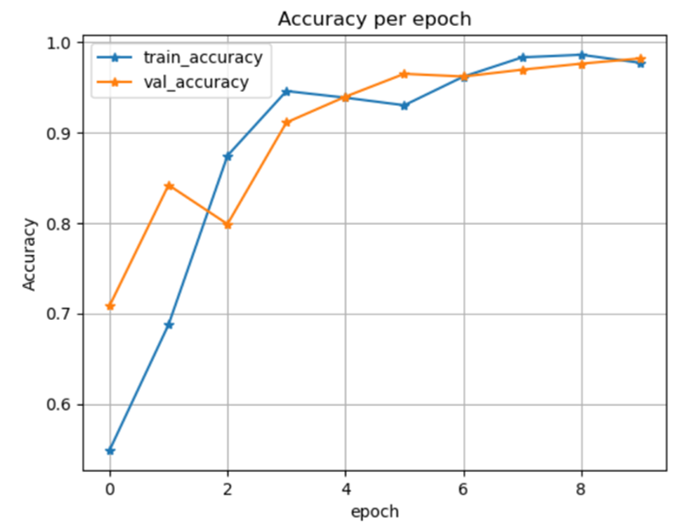
Figure 9. Training and validation accuracy
|
Table 1. Comparative Analysis |
|
|
Method |
Accuracy |
|
DeepLabV3+ |
0,89 |
|
PSPNet |
0,91 |
|
Proposed Method |
0,95 |
Table 1 presents a comparative analysis of semantic segmentation methods used for analyzing diabetic vasculopathy in thermoregulation images, highlighting their respective accuracies. DeepLabV3+ achieves an accuracy of 0,89 by employing atrous convolutions and a refined decoder that effectively capture multi-scale contextual information and enhance segmentation precision. PSPNet improves upon this with an accuracy of 0,91, utilizing its Pyramid Pooling Module to gather contextual information at different scales, which enhances both the global understanding and fine local details of the image. The Proposed Method, using UNet++, significantly outperforms both, achieving a remarkable accuracy of 0,95. UNet++ integrates nested and dense skip connections, allowing for superior feature propagation and gradient flow, which are crucial for capturing intricate vascular patterns and anomalies in the thermoregulation images.
CONCLUSION
The proposed research work shows the effectiveness of using semantic segmentation for diabetic vasculopathy analysis based on thermoregulation imaging. Main findings show that the devised method of integration MobileNetV2 with Unet++ architecture obtained better efficiency, demonstrated by an extended segmentation accuracy of 95 % compared to the state of art methods like DeepLabV3+ (89 %) and PSPNet (91 %). During training Segmentation performance, measured by Mean Intersection over Union (IoU), was fairly accurate with 87 % and validation data with 85 %, which suggests that the model can accurately predict regions of interest indicative of vascular abnormalities. The results of the proposed deep learning model greatly improve the accuracy and dependability of non-invasive diagnosis of diabetic vasculopathy.
REFERENCES
1. Gururajarao SB, Venkatappa U, Shivaram JM, Sikkandar MY, and Al Amoudi A. Infrared thermography and soft computing for diabetic foot assessment. In Machine Learning in Bio-Signal Analysis and Diagnostic Imaging, pp. 73-97. https://doi.org/10.1016/B978-0-12-816086-2.00004-7.
2. Patel K, Horak H, and Tiryaki E. Diabetic neuropathies. Muscle & Nerve, 63(1), pp. 22-30. https://doi.org/10.1002/mus.27014.
3. Yavuz DG. Classification, risk factors, and clinical presentation diabetic neuropathy. In Diabetic neuropathy, pp. 1-9. https://doi.org/10.1016/B978-0-12-820669-0.00014-1
4. Sloan G, Pan Q, Gao L, Guo L, and Tesfaye S. Clinical Features of Diabetes Neuropathies. In Diabetic Neuropathy: Advances in Pathophysiology and Clinical Management, pp. 37-49. https://doi.org/10.1007/978-3-031-15613-7_3.
5. Tsakiridis I, Mamopoulos A, Athanasiadis A, Kourtis A, and Dagklis T. Management of pregestational diabetes mellitus: a comparison of guidelines. The Journal of Maternal-Fetal & Neonatal Medicine, 35(3), pp. 423-432. https://doi.org/10.1080/14767058.2020.1719481.
6. Qin X, Chen D, Zhan Y, and Yin D. Classification of diabetic retinopathy based on improved deep forest model. Biomedical signal processing and control, 79, p. 104020. https://doi.org/10.1016/j.bspc.2022.104020.
7. Gizińska M, Rutkowski R, Szymczak-Bartz L, Romanowski W, and Straburzyńska-Lupa A. Thermal imaging for detecting temperature changes within the rheumatoid foot. Journal of Thermal Analysis and Calorimetry, 145(1), pp. 77-85. https://doi.org/10.1007/s10973-020-09665-0.
8. Hernandez-Contreras DA, Peregrina-Barreto H, de Jesus Rangel-Magdaleno J, and Renero-Carrillo FJ. Plantar thermogram database for the study of diabetic foot complications. IEEE Access, 7, pp. 161296-161307. https://doi.org/10.1109/ACCESS.2019.2951356.
9. Salazar CA, and Zequera Díaz ML. Thermography as a diagnostic tool for early detection of diabetic foot ulceration risk: a review. In VIII Latin American Conference on Biomedical Engineering and XLII National Conference on Biomedical Engineering: Proceedings of CLAIB-CNIB 2019, October 2-5, 2019, Cancún, México, pp. 1233-1252. https://doi.org/10.1007/978-3-030-30648-9_16.
10. Anaya-Isaza A, and Zequera-Diaz M. Fourier transform-based data augmentation in deep learning for diabetic foot thermograph classification. Biocybernetics and Biomedical Engineering, 42(2), pp. 437-452. https://doi.org/10.1016/j.bbe.2022.03.001.
11. Astasio-Picado Á, Martínez EE, and Gómez-Martín B. Comparative thermal map of the foot between patients with and without diabetes through the use of infrared thermography. Enfermería Clínica (English Edition), 30(2), pp. 119-123. https://doi.org/10.1016/j.enfcle.2018.11.004.
12. Serantoni V, Jourdan F, Louche H, Avignon A, and Sultan A. Definition of thermal indicators for the study of thermoregulation alterations in the foot of people living within diabetic peripheral neuropathy: A proof of concept. Journal of Thermal Biology, 118, p. 103729. https://doi.org/10.1016/j.jtherbio.2023.103729.
13. Arabi PM, Joshi G, Lohith S, Mubashir M, Pallavi PY, and Surabhi M. Early Diagnosis of Diabetic Vasculopathy by Thermo-Regulatory Vascular Impairment. In 2020 5th International Conference on Communication and Electronics Systems (ICCES), pp. 1368-1373. https://doi.org/10.1109/ICCES48766.2020.9137907.
14. Duan Y, Zhang K, Xu Y, Ren W, and Pu F. A promising method for reducing the incidence of diabetic foot ulcers: Regulating foot temperature during walking. Medical Hypotheses, 183, p. 111268. https://doi.org/10.1016/j.mehy.2024.111268.
15. Fasihi-Shirehjini O, and Babapour-Mofrad F. Effectiveness of ConvNeXt variants in diabetic feet diagnosis using plantar thermal images. Quantitative InfraRed Thermography Journal, pp. 1-18. https://doi.org/10.1080/17686733.2024.2310794.
16. Cornelius VA, Fulton JR, and Margariti A. Alternative Splicing: A Key Mediator of Diabetic Vasculopathy. Genes, 12(9), p. 1332. https://doi.org/10.3390/genes12091332.
FINANCING
The authors did not receive financing for the development of this research.
CONFLICT OF INTEREST
The authors declare that there is no conflict of interest.
AUTHORSHIP CONTRIBUTION
Conceptualization: Gayatri Joshi.
Data curation: Gayatri Joshi.
Formal analysis: Gayatri Joshi.
Research: Punal M Arabi.
Methodology: Punal M Arabi.
Drafting - original draft: Gayatri Joshi.
Writing - proofreading and editing: Punal M Arabi.