doi: 10.56294/dm2024.381
ORIGINAL
A decision-making system for the entire life cycle industry chain based on data mining technology optimization
Un sistema de toma de decisiones para toda la cadena industrial del ciclo de vida basado en la optimización de la tecnología de minería de datos
Bahar Asgarova1, Elvin Jafarov1, Nicat Babayev1, Allahshukur Ahmadzada1 *, Vugar Abdullayev1, Yitong Niu2
1Azerbaijan State Oil and Industry University. Baku, Azerbaijan.
2School of Industrial Technology, Universiti Sains Malaysia. Penang, Malaysia.
Cite as: Asgarova B, Jafarov E, Babayev N, Ahmadzada A, Abdullayev V, Niu Y. A decision-making system for the entire life cycle industry chain based on data mining technology optimization. Data and Metadata. 2024; 3:.381. https://doi.org/10.56294/dm2024.381
Submitted: 04-02-2024 Revised: 08-05-2024 Accepted: 24-08-2024 Published: 25-08-2024
Editor: Adrián
Alejandro Vitón Castillo ![]()
ABSTRACT
When developing a biomass production plan, the factors that influence decision makers include not only the different parts of the biomass supply chain itself, but also the social, environmental and economic impacts of the biomass system and the degree of difficulty in developing it within a particular country. In order to take these factors into account, this paper proposes a two-tier generalised decision-making system (gBEDS) for biomass, with a database at its core, including basic biomass information and detailed decision-making information, in addition to a database of scenarios and a library of case studies that provide demonstrations for new users. On the basis of the database, the decision-making system includes a simulation module for the unit process (uP) and a genetic algorithm for optimising the decisions. With the help of a graphical interface, users can define their own biomass supply chain and evaluate it environmentally, economically, socially or otherwise; on the basis of a simulation and optimisation model of the whole life cycle of biomass production, the system uses data mining methods (fuzzy c-mean clustering and decision trees) to determine the optimal geographic location of the biomass raw material collection and storage and conversion plants. Madab was used to develop a computational model for biomass planning parameters (e.g. costs and c02 emissions) for the biomass supply chain. At the same time, a visual representation of the bioenergy conversion plant and storage data is made using Geographic Information Systems (GIs) to support users in making decisions based on intelligent outputs. Thus, gBEDS supports biomass national planners in developing an effective biomass production plan with comprehensive evaluation, and local designers and implementers in defining optimised, detailed unit processes to implement said plan.
Keywords: Biomass Energy Industry Chain; Data Mining; Fuzzy C-Means Clustering; Decision Support System.
RESUMEN
A la hora de elaborar un plan de producción de biomasa, los factores que influyen en los responsables de la toma de decisiones incluyen no sólo las distintas partes de la cadena de suministro de biomasa en sí, sino también las repercusiones sociales, medioambientales y económicas del sistema de biomasa y el grado de dificultad para desarrollarlo dentro de un país concreto. Para tener en cuenta estos factores, este documento propone un sistema generalizado de toma de decisiones (gBEDS) para la biomasa en dos niveles, con una base de datos como núcleo, que incluye información básica sobre la biomasa e información detallada sobre la toma de decisiones, además de una base de datos de escenarios y una biblioteca de casos prácticos que ofrecen demostraciones a los nuevos usuarios. A partir de la base de datos, el sistema de toma de decisiones incluye un módulo de simulación del proceso unitario (uP) y un algoritmo genético para optimizar las decisiones. Con ayuda de una interfaz gráfica, los usuarios pueden definir su propia cadena de suministro de biomasa y evaluarla desde el punto de vista medioambiental, económico, social o de otro tipo; sobre la base de un modelo de simulación y optimización de todo el ciclo de vida de la producción de biomasa, el sistema utiliza métodos de minería de datos (agrupación c-mean difusa y árboles de decisión) para determinar la ubicación geográfica óptima de las plantas de recogida y almacenamiento de materias primas de biomasa y de conversión. Madab se utilizó para desarrollar un modelo computacional de los parámetros de planificación de la biomasa (por ejemplo, costes y emisiones de c02) para la cadena de suministro de biomasa. Al mismo tiempo, se realiza una representación visual de los datos de las plantas de conversión y almacenamiento de bioenergía mediante Sistemas de Información Geográfica (SIG) para ayudar a los usuarios a tomar decisiones basadas en resultados inteligentes. De este modo, gBEDS ayuda a los planificadores nacionales de biomasa a elaborar un plan eficaz de producción de biomasa con una evaluación exhaustiva, y a los diseñadores y ejecutores locales a definir procesos unitarios optimizados y detallados para poner en práctica dicho plan.
Palabras clave: Cadena de la Industria Energética de la Biomasa; Minería de Datos; Agrupación de C-Medias Difusas; Sistema de Apoyo a la Toma de Decisiones.
INTRODUCTION
Biomass energy industry refers to the whole process of transforming biomass raw materials such as energy plants and agricultural wastes into high value-added biomass energy, biomaterials, substitutes for petroleum products and by-products and other environmentally friendly products through industrialisation using chemical or biological technologies. Biomass industrialisation includes both the industrial chain and technology system of biomass feedstock production - fuel production - product and application (vehicle/combustion) integration, as well as the guarantee system of policy, regulation, market and circulation.
The evaluation of biomass energy industry chain can be carried out from various perspectives, such as economic benefits, environmental benefits and identification of leading enterprises. However, at present, the evaluation of biomass energy industry chain is only limited to the life cycle evaluation method, and the evaluation content is mostly the evaluation of its environmental benefits and energy efficiency, and the evaluation object is mostly for a single biomass energy product industry chain, and there is too little evaluation for biomass energy industry chain with high integration of biomass energy products and network structure.
Over the last 20 years, research on biomass energy has focused on the evaluation of the potential for biomass development, possible promotion methods and the application of decision support systems to biomass production. Mitcheu reviewed a large number of decision support models and systems and found that most were built and designed to support technical and economic feasibility, with little consideration of the environmental and social impacts of biomass use. Only a few decision-support systems have been developed using geographic information systems (Gls) after considering environmental and economic impacts. Previously proposed decision support systems and models in the field of bioenergy were specific to one particular type of biomass type and focused only on the local or national state level decision-making hierarchy. There is a need for an integrated system that takes both levels into account and considers all aspects of bioenergy production.
A decision support system (Dss) is a computer technology solution that can be used to support complex decision making and problem solving by providing the user with a user-friendly computer interface and representing the results in a form that is easy to understand. As the society slowly tends to look for economical methods of production, a user-oriented decision support system is needed to meet such changes. Considering the previous work and its limitations, this paper proposes a generalised decision making system (gBEDs) with knowledge discovery (i.e., data mining) to aid in the development of bioenergy production plans and their effective implementation. It divides bioenergy production decisions into two levels, national and local, and synthesises production plans using different data analysis, simulation and visualisation methods respectively.
The objectives of national planners, who propose a biomass development strategy for the whole country, are different from those of local planners who have specific requirements and are constrained by conditions (e.g., resource viability, geographic limitations, energy needs) that must be taken into account when developing the system. For the former, they consider the following factors: biomass feedstock available within the country, conversion technologies from different biomasses to different bioenergies, economic factors, which means that only rough modelling is applied for macro plans. On the basis of their decisions, the latter will decide on the detailed production steps to meet the decisions, consisting of the following components: definition of the detailed optimal size of each biomass plant in terms of energy production and feedstock; determination of the percentage of electrical energy production in relation to the total energy production; the amount of biomass to be collected and the detailed collection locations. Special consideration is given to rigorous biomass modelling and its logistical costs, energy conversion costs and labour costs. In order to smoothly control the exploitation of biomass, the user needs to have information on the amount that can be collected, the geographical location of the collection points in order to reduce transport costs. National planners make judgements based on local plans, decisions made by implementers to use, amend or reject.
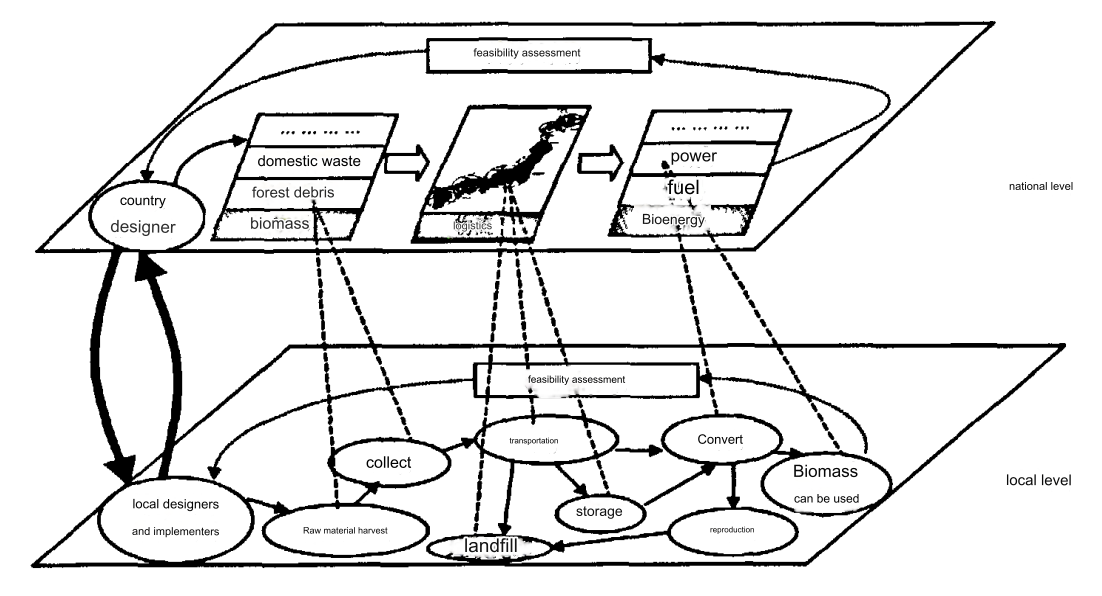
Figure 1. Two-tier decision-making system with different goals in gBEDs
Having described the two-level decision-making system, the relationship between the two levels needs to be clarified. As shown in figure 1, decision makers at the national level base their decisions on simple cost, labour and environmental models in order to decide on the selection of specific biomass feedstocks, biomass logistics options and bioenergy conversion methods. At the same time, at the national level, the whole land is divided into several local areas using the fuzzy c-clustering method of the GIS database of biomass distribution, but this method does not take into account the geographic information of the actual area, e.g., it covers some areas where it is not possible to transport biomass. Therefore, decision-making at the national level should take into account the local reality. Local design decisions need input information for some decisions at the national level to calculate the actual costs based on detailed modelling. Therefore, it can be summarised as follows: for such complex problems, there is an integrated process in the two-tier decision-making process, which leads to simultaneous decision-making at both decision-making levels: first, based on a simple model at the national level, a decision is made on which biomass feedstock to use and which bioenergy conversion method to use; after that, a specific model at the local level is used to evaluate the decision, and if it is feasible, a second-tier decision is made, or else the decision is returned to the national level , correct the decision and repeat the above steps. This type of collaborative operation requires more decision makers to work together and share information, so it is important to develop decision support systems (DDS) for biomass decision making.
METHOD
Input-Output Method
Currently, the input-output approach has moved from analysing research at the national (or regional) level to analysing research at the industry level and at the enterprise level. At the industry level, combining the material flow analysis method with the input-output model and developing the study of material flow input-output table can provide a new perspective for the in-depth study of the industrial chain at the industry level. Input-output table is a method to express the interdependence between industries in the form of matrix, which is a tool to record and reflect the flow and exchange relationship of products and services occurring between industries in an economic system in a certain period of time and provides a quantitative analysis tool for the industrial chain. The input-output model in the input-output analysis method can be divided into two modes: physical type and value type, and this paper mainly adopts the value type mode. Table 1 shows a simplified value-based input-output table.
|
Table 1. Simplified value-based input-output table |
|||||||
|
Intermediate Input |
Intra-group Enterprises Intermediate Usage |
Final Usage |
Total Output |
||||
|
|
Enterprise 1 |
Enterprise 2 |
... |
Enterprise n |
|
|
|
|
Intra-group Enterprises Intermediate Input |
X11 |
X12 |
... |
X1n |
K1m |
Y1 |
X1 |
|
Enterprise 2 |
X21 |
X22 |
... |
X2n |
K2m |
Y2 |
X2 |
|
... |
... |
... |
... |
... |
... |
... |
... |
|
Enterprise n |
Xn1 |
Xn2 |
... |
Xnn |
Knm |
Yn |
Xn |
|
Inter-group Enterprises Intermediate Input m |
Lm1 |
Lm2 |
... |
Lmn |
|
|
|
|
Value Added |
G1 |
G2 |
... |
Gn |
|
|
|
|
Total Input |
X1 |
X2 |
... |
Xn |
|
|
|
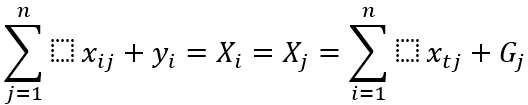
In table l, firm l, firm 2, ..., firm n represents the systems in the group, E represents end use, G, value added, V represents total output, and Shi represents total inputs. The horizontal rows represent the outputs of each system, reflecting where the product goes after it is made, and the vertical columns represent the inputs of each system, reflecting how the biomass product is formed and how much live and physical labour is invested. The following relationship exists in table 1:
General Bioenergy Decision System (gBEDS)
Based on a repository of information on technologies within the biomass life cycle, gBEDs simultaneously support the design and implementation of integrated biomass energy utilisation, taking into account the following aspects: economic impacts (including total investment in setting up a bioenergy business, cost per kWh point, etc.); environmental impacts (GHG emissions, energy efficiency and promotion of renewable energy generation quota system RPs) and social impacts (creation of employment opportunities and energy taxes). (job creation and use of energy taxes).
In order to consider environmental issues throughout the life cycle from biomass to bioenergy, Ms Access 2000 was used to develop a shared database of experts in all directions of biomass harvesting, transport, conversion, which not only stores data but also allows searching for relevant data. It includes:
1. Basic information on the whole life cycle of biomass and bioenergy: e.g. GIS database, biomass feedstock database, biomass logistics database and biomass conversion database;
2. Model information for biomass and bioenergy decision-making: e.g. model databases storing variables, parameters and equations, which consist of a number of sub-model (i.e. uP) databases;
3. Detailed decision information: e.g. parameter databases storing default values, variable databases consisting of databases of simulated values (e.g. values are obtained by simulation), optimal value databases;
4. Scenario databases are likewise stored in the system for demonstration purposes for new users and also used as a case base for reasoning. The different databases are managed through a suitable open database (ODBC) interface.
The system allows experts to plan, design and implement biomass at national and local level. Decision-making is built on the basis of the following modules:
1. A technical information base shared by the users.
2. Data visualisation using esm's arcgis9 and gis-based interfaces.
3. Fuzzy c-mean clustering method for optimal decision-making and g iv, with source code provided by maⅡab.
4. A unit process simulation interface defined according to up.
5. Embedded domain knowledge for evaluating the user's choice of supply chain.
6. An interface for evaluating the user's choice of supply chain.
7. A domain knowledge system for evaluating the user's choice of supply chain.
8. The modules and user interfaces mentioned above.
The GIS database provides the amount of biomass resources (tonnes/year) for each city. As described below, it helps users to obtain useful information from these data.
The amount of biomass that can be used for energy production, other than for purposes such as fertiliser, bio-products, etc., is called the amount of biomass available. It is assumed that the proportion of available biomass for a given purpose to the total is fixed at the national level. However, at the local level, this may vary from city to city. Applying the algorithm in table 2 determines the possible number of collection points and their location in each municipality. Various biomass types are available for collection of all biomass types, except for those forested areas that are too far from the road. The distance is defined by the user and the system ignores biomass beyond the distance.
|
Table 2. Collection point determination algorithm |
|
|
Program |
Determining Collection Point Data |
|
Program Definition: |
Objective: determine the location of the production collection points near the urban center’s random machines, determine the biomass at each point, and determine the number of feasible collection points. |
|
|
Input: Urban center, biomass at each stump, number of stumps per hectare. |
|
|
Output: urban center, biomass at each collection point. |
|
Constant |
Residual accumulation of dry matter in stumps |
|
Constant |
Number of stumps per hectare |
|
Calculate |
(Collection quantity at each collection point) |
|
|
(Objective of city collection points) |
|
For |
(each urban center i) |
|
Generate x |
(random for each collection point) // x, y as longitude and latitude of collection point // |
|
Generate y |
(random for each collection point) |
|
endfor |
|
The links within the biomass supply chain are closely interconnected, and it is easy to understand how decisions made upstream affect subsequent behaviour within the chain. For example, a very simple harvesting method may increase both costs and cO: emissions due to complex transport and conversion units. gBEDS, with its unit process simulation (uPs) interface and embedded domain knowledge capability, helps decision makers to set up technically feasible production chains.
Based on the user-defined supply chain, gBEDS automatically and optimally determines the location of the storage point, the optimal capacity, and the shortest possible transport distances between the bioenergy conversion plant and the collection point and storage, which reduces the transport costs, CO2: emissions and the number of labourers. These can be achieved by a fuzzy c-mean clustering method for collection points. Fuzzy c-mean clustering is a non-hierarchical clustering method that divides collection points into c clusters by minimising the following function:
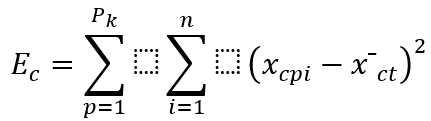
Where c is the subscript of the clusters, c = 1, ..., c; i = l, ..., n0xcpt is the value of the ith dimensional variable for the pth data point out of the Pk data points within the cth cluster, xci is the mean value on the ith dimension (i.e., the centre of mass of the ith dimension) within the cth cluster, and Ec is the sum of the squares of the errors of the clusters c.
Set the storage point as the centre of mass of the cluster. Then, in order to determine the location of each bioenergy conversion unit, the storage point (centre of mass of the first clustering iteration) is clustered assuming that the plant is also located in the centre of mass of the cluster and the size of the cluster is referenced to Ec, which implies a transport cost between the collection point to the storage and storage to the conversion unit. Simultaneous optimisation using fuzzy c-mean clustering method
There are two possible methods in gBEDs to determine the number and location of storage and bioenergy conversion devices. The first method is to provide the user with a data visualisation that allows them to determine the location on a GIS screen based on their personal experience, but this method is very time-consuming. The second method is to help the user to automatically determine the number and location by using the clustering eigenfunction as a criterion, which shows whether the clustering algorithm can divide the given data group well. gBEDs uses the eigenfunction introduced by R and y et al. to obtain the optimal number of clusters, which is represented below:
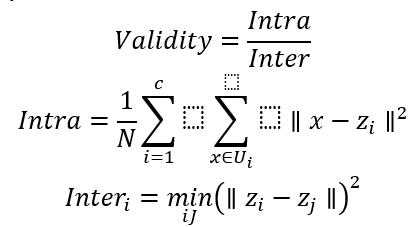
Where: c= 1,2,...C-1; j=c+1,c+2,...,C, N is the number of collection points, c is the number of clusters, and zc denotes the spatial location of the storage or plant Ui.
RESULTS
In order to verify the feasibility of the methodology, the following is an example of Plant X in Malaysia.
Evaluation of the biomass industry chain
In order to verify the feasibility of the methodology, the following is an example of Plant X in Malaysia.
Plant X is framed by a petroleum plantation, a methanol-based fuel system, a biodiesel-bio-lubricant cogeneration system, a fibre-to-ethanol system, a cogeneration system, and an integrated environmental treatment system, with the systems interconnected through the inter-exchange of intermediate products and wastes, thus forming a relatively complete biomass energy industry chain Network. According to the material consumption relationship and cost data of each biomass energy project within the group, a group's industrial chain value-based input and output table 3 is derived.
Based on the data provided in table 3, the input-output evaluation index of EF Group is calculated, as shown in table 4.
|
Table 3. Plant x biomass chain value plough input-output table (RM million) |
|||||
|
Intermediate use by companies within the group |
|||||
|
Intermediate inputs of enterprises within the group |
Co-production of methanol-based chemicals |
Biodiesel and biolubricant co-production |
Ethanol-based fuel from fibrous plants |
Thermoelectric |
Environmental treatment costs |
|
Co-production of methanol-based chemicals |
17 820 |
1 750 |
|
1 973,4 |
309 |
|
Biodiesel and biolubricant co-production |
|
|
|
|
2 101 |
|
Ethanol-based fuel from fibrous plants |
|
|
|
|
200 |
|
Thermoelectric |
4 501,6 |
4 869 |
2 648 |
|
90 |
|
Environmental treatment costs |
1 700 |
|
1 000 |
|
10 |
|
Intermediate inputs from companies outside the group |
49 458 |
21 360,58 |
26 141 |
2 460 |
|
|
Initial investment |
110 691,4 |
96 921,4 |
28 411 |
|
|
|
Total investment |
184 171 |
168 132 |
60 000 |
12 293,4 |
2 710 |
|
Table 4. Using input-output evaluation indicators |
|||||||
|
|
|
|
Methanol |
Biodiesel |
Ethanol |
Thermoelectricity |
Environmental treatment costs |
|
Evaluation of leading enterprises |
Sensitivity coefficient |
1,50397 |
2,58785 |
0,24631 |
0,54807 |
0,11381 |
|
|
Influence coefficient |
0,51712 |
0,14991 |
0,27984 |
0,60062 |
3,45251 |
||
|
Driving force coefficient |
0,31310 |
0,05627 |
0,01477 |
2,26533 |
2,35051 |
||
|
Coefficient of driving force |
2,66083 |
0,91341 |
1,29221 |
0,05136 |
0,08218 |
||
|
Coefficient of variance |
1,45211 |
1,43680 |
0,97437 |
2,12249 |
1,48758 |
||
|
Evaluation of the industrial chain of the park |
Direct consumption coefficient of material inputs from within and outside the group |
Methanol |
0,0968 |
0,0104 |
0 |
0,1605 |
0,1140 |
|
Biodiesel |
0 |
0 |
0 |
0 |
0,7753 |
||
|
Ethanol |
0 |
0 |
0 |
0 |
0,0738 |
||
|
Thermoelectricity |
0,0244 |
0,0290 |
0,0441 |
0 |
0,0332 |
||
|
Environmental treatment costs |
0,0092 |
0 |
0,0167 |
0 |
0,0037 |
||
|
Complete consumption coefficient of material inputs from within and outside the group |
Methanol |
0,1135 |
0,0168 |
0,0103 |
0,1787 |
0,1472 |
|
|
Biodiesel |
0,008 |
0,0001 |
0,0131 |
0,0013 |
0,7802 |
||
|
Ethanol |
0,0008 |
0 |
0,0012 |
0,0001 |
0,0743 |
||
|
Thermoelectricity |
0,0278 |
0,0294 |
0,0454 |
0,0045 |
0,0629 |
||
|
Environmental treatment costs |
0,0103 |
0,0002 |
0,0168 |
0,0017 |
0,0063 |
||
|
Intermediate input ratio of enterprises within the group |
0,13043 |
0,03937 |
0,0608 |
0,16053 |
|
||
|
Evaluation of the park's operation status |
Value-added contribution of each enterprise within the group |
0,46898 |
0,41064 |
0,12037 |
|
|
|
|
Intermediate consumption rate of each enterprise within the group |
0,13043 |
0,03937 |
0,0608 |
0,16053 |
1 |
||
Identification and evaluation of economic and technological connections between enterprises in the chain. By comparing the direct consumption coefficient table and the complete consumption coefficient table, it is found that the biodiesel and bio-lubricant co-production system and the fiber-to-ethanol system, the methanol-based fuel system and the ethanol-based fuel system have no direct correlation. There are many systems that are indirectly related to the biodiesel and bio-lubricant co-production system, which shows that the biodiesel and bio-lubricant co-production system has a strong indirect pulling ability. The intermediate input ratio of enterprises in the environmental treatment system group is 1, indicating that the system mainly uses the materials provided by enterprises in the group. The proportion is also high, indicating that the system is highly dependent on the group; the intermediate input ratio of enterprises in the group reflects the proportion of materials used by each other within the group in the total intermediate input of each system. It can indirectly reflect the dependence of various systems in the park on materials outside the group.
Identification of leading enterprises in the Plant X industrial chain. The characteristics that the leading enterprises in the park should have are: the sensitivity coefficient, influence coefficient, driving force coefficient and co-driving force coefficient are large, and the variance coefficient is small. By directly observing and comparing these coefficients of each system, it is impossible to determine the system with higher compliance, so the problem must be solved with the help of a certain mathematical model.
Set the objective function as:
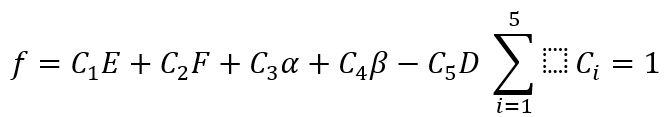
Among them, E, F, a, B, and D represent the sensitivity coefficient, influence coefficient, driving force coefficient, uniform driving force coefficient, and variance coefficient respectively. And find out the group enterprise corresponding to the maximum value of the function, which is the leading enterprise in the biomass energy industry chain of Factory X.
Analyzing from the meaning represented by each coefficient, the weight ranking of the importance of the coefficient is obtained as follows:
Influence coefficient = sensitivity coefficient driving force coefficient = variance coefficient of uniform driving force coefficient
The objective function is solved by numerical simulation method. The specific steps are: according to the important ranking results of each evaluation index, different weight coefficients are set to obtain the corresponding objective function value, as shown in table 5 and table 6:
|
Table 5. Coefficient C value setting table |
|||||
|
Group |
Methanol |
Biodiesel |
Ethanol |
Thermoelectricity |
Environmental treatment costs |
|
1 |
1/5 |
1/5 |
1/5 |
1/5 |
1/5 |
|
2 |
2/9 |
2/9 |
2/9 |
2/9 |
1/9 |
|
3 |
3/13 |
3/13 |
3/13 |
3/13 |
1/13 |
|
4 |
4/17 |
4/17 |
4/17 |
4/17 |
1/17 |
|
5 |
5/21 |
5/21 |
5/21 |
5/21 |
1/21 |
|
6 |
4/15 |
4/15 |
1/5 |
1/5 |
1/15 |
|
7 |
1/4 |
1/4 |
3/16 |
3/16 |
1/8 |
|
8 |
5/17 |
5/17 |
3/17 |
3/17 |
1/17 |
|
Table 6. Objective function f simulation value table |
|||||
|
|
Methanol |
Biodiesel |
Ethanol |
Thermoelectricity |
Environmental treatment costs |
|
f |
3,5429 |
2,2706 |
0,8588 |
1,3429 |
4,5114 |
|
f₂ |
0,9487 |
0,6642 |
0,2991 |
0,5343 |
1,1678 |
|
f₃ |
1,0410 |
0,7450 |
0,3481 |
0,6364 |
1,2700 |
|
f4 |
1,0899 |
0,7878 |
0,3740 |
0,6905 |
1,3240 |
|
fs |
1,1201 |
0,8143 |
0,3901 |
0,7240 |
1,3575 |
|
f₆ |
1,0369 |
0,8282 |
0,3367 |
0,6282 |
1,3384 |
|
f7 |
0,8814 |
0,6867 |
0,2548 |
0,4562 |
1,1618 |
|
fg |
1,0338 |
0,8918 |
0,3281 |
0,6218 |
1,3907 |
According to the results of data simulation, when the weights of the evaluation indexes of the dominant enterprises are changed to some extent, the ordering of the dominant role of each system is unanimously concluded: ring office>methanol>biodiesel>thermal power>ethanol.
Evaluation of the quality of economic operation of Plant X's industrial chain. Since the main products of the group are bio-methanol, biodiesel and fuel ethanol, the evaluation of the group's economic situation mainly focuses on these three major product systems.
The degree of value added contribution of each enterprise in the group reflects the pulling effect of an enterprise on the overall economy of the group, and the value added contribution of Plant X's methanol-based fuel system, biodiesel, and bio-lubricant cogeneration system are 46,90 % and 41,06 % respectively, which are more capable than the fibre-based ethanol system to be the main driving force of the overall economic growth of the group.
The intermediate consumption rate of enterprises within the Group is relatively high in methanol-based fuel system, followed by fibre-based ethanol system and biodiesel, bio-lubricant co-production system. There are a number of ways to improve the overall efficiency of the Group, of which reducing the intermediate consumption rate is one of the more effective ones, so there is still room to reduce the intermediate consumption rate of methanol-based fuel systems.
Overall, the biodiesel and bio-lubricants co-generation systems contribute significantly to the Group's value-added and have the lowest level of intermediate consumption rates, which is ideal. In fact, the ability of each system in the Group to produce properly affects the stability of the Group's industrial chain and the durability of the Group's existence.
CONCLUSIONS
This paper proposes a generalised decision-making system (gBEDs) for the comprehensive use of biomass energy, which includes a unit process (uP) visual simulation module and a genetic algorithm for optimal decision-making. And the input-output method was used to analyse the material flow of the biomass energy industrial system from three sides, namely the economic and technological links of the enterprises in the chain, the identification of the dominant enterprises, and the quality of the overall economic operation; the input-output table can not only provide a complete record and an in-depth analysis of the material metabolism dependence within the economic system, but also provide technical support for the evaluation model of the biomass energy industry chain. At the industrial level, combining the material flow analysis method with the input-output model and developing the study of material flow input-output table can provide a new perspective for the in-depth study of the industrial chain at the industrial level.
BIBLIOGRAPHIC REFERENCES
1. Ayoub, N., Martins, R., Wang, K., Seki, H., & Naka, Y. (2007). Two levels decision system for efficient planning and implementation of bioenergy production. Energy Conversion and Management, 48(3), 709–723. https://doi.org/10.1016/j.enconman.2006.09.012
2. Charte, F., Romero, I., Pérez-Godoy, M. D., Rivera, A. J., & Castro, E. (2017). Comparative analysis of data mining and response surface methodology predictive models for enzymatic hydrolysis of pretreated olive tree biomass. Computers & Chemical Engineering, 101, 23–30. https://doi.org/10.1016/j.compchemeng.2017.02.008
3. Čuček, L., Varbanov, P. S., Klemeš, J. J., & Kravanja, Z. (2012). Total footprints-based multi-criteria optimisation of regional biomass energy supply chains. Energy, 44(1), 135–145. https://doi.org/10.1016/j.energy.2012.01.040
4. De Meyer, A., Cattrysse, D., Rasinmäki, J., & Van Orshoven, J. (2014). Methods to optimise the design and management of biomass-for-bioenergy supply chains: A review. Renewable and Sustainable Energy Reviews, 31, 657–670. https://doi.org/10.1016/j.rser.2013.12.036
5. Frankowska, M., Błoński, K., Mańkowska, M., & Rzeczycki, A. (2022). Research on the Concept of Hydrogen Supply Chains and Power Grids Powered by Renewable Energy Sources: A Scoping Review with the Use of Text Mining. Energies, 15(3), Article 3. https://doi.org/10.3390/en15030866
6. Gawusu, S., Mensah, R. A., & Das, O. (2022). Exploring distributed energy generation for sustainable development: A data mining approach. Journal of Energy Storage, 48, 104018. https://doi.org/10.1016/j.est.2022.104018
7. Gital Durmaz, Y., & Bilgen, B. (2020). Multi-objective optimization of sustainable biomass supply chain network design. Applied Energy, 272, 115259. https://doi.org/10.1016/j.apenergy.2020.115259
8. Kheybari, S., Rezaie, F. M., Naji, S. A., & Najafi, F. (2019). Evaluation of energy production technologies from biomass using analytical hierarchy process: The case of Iran. Journal of Cleaner Production, 232, 257–265. https://doi.org/10.1016/j.jclepro.2019.05.357
9. Li, G.-S., Bai, X., Wang, M.-H., Fan, X., He, X.-Y., Dilixiati, Y., Wei, X.-Y., Zou, H.-X., & Pidamaimaiti, G. (2024). Combination of chemometrics and mass spectrometric methods for the data mining of molecular structure information of coal and biomass. Fuel, 361, 130714. https://doi.org/10.1016/j.fuel.2023.130714
10. Lo, S. L. Y., How, B. S., Leong, W. D., Teng, S. Y., Rhamdhani, M. A., & Sunarso, J. (2021). Techno-economic analysis for biomass supply chain: A state-of-the-art review. Renewable and Sustainable Energy Reviews, 135, 110164. https://doi.org/10.1016/j.rser.2020.110164
11. Niu, Y. (2023). Research progress of biomass energy conversion technology and application in China. 3(2).
12. Niu, Y., & Korneev, A. (2021a). Application Study of Intelligent Agricultural Photovoltaic Power Generation Tracking System. 2021 IEEE Bombay Section Signature Conference (IBSSC), 1–4. https://doi.org/10.1109/IBSSC53889.2021.9673430
13. Niu, Y., & Korneev, A. (2021b). Explore the current situation and development trend of China’s straw power generation industry. AMA, Agricultural Mechanization in Asia, Africa and Latin America, 52(1), 2089–2096.
14. Nunes, L. J. R., Causer, T. P., & Ciolkosz, D. (2020). Biomass for energy: A review on supply chain management models. Renewable and Sustainable Energy Reviews, 120, 109658. https://doi.org/10.1016/j.rser.2019.109658
15. Paolotti, L., Martino, G., Marchini, A., & Boggia, A. (2017). Economic and environmental assessment of agro-energy wood biomass supply chains. Biomass and Bioenergy, 97, 172–185. https://doi.org/10.1016/j.biombioe.2016.12.020
16. Paredes-Sánchez, B. M., Paredes-Sánchez, J. P., & García-Nieto, P. J. (2022). Evaluation of Implementation of Biomass and Solar Resources by Energy Systems in the Coal-Mining Areas of Spain. Energies, 15(1), Article 1. https://doi.org/10.3390/en15010232
17. Rafael, S., Tarelho, L., Monteiro, A., Sá, E., Miranda, A. I., Borrego, C., & Lopes, M. (2015). Impact of forest biomass residues to the energy supply chain on regional air quality. Science of The Total Environment, 505, 640–648. https://doi.org/10.1016/j.scitotenv.2014.10.049
18. Shabani, N., & Sowlati, T. (2013). A mixed integer non-linear programming model for tactical value chain optimization of a wood biomass power plant. Applied Energy, 104, 353–361. https://doi.org/10.1016/j.apenergy.2012.11.013
19. Tavana, M., Shaabani, A., Javier Santos-Arteaga, F., & Raeesi Vanani, I. (2020). A Review of Uncertain Decision-Making Methods in Energy Management Using Text Mining and Data Analytics. Energies, 13(15), Article 15. https://doi.org/10.3390/en13153947
20. Zhang, G., & Long, W. (2010). A key review on emergy analysis and assessment of biomass resources for a sustainable future. Energy Policy, 38(6), 2948–2955. https://doi.org/10.1016/j.enpol.2010.01.032
FINANCING
The authors did not receive financing for the development of this research.
CONFLICT OF INTEREST
The authors declare that there is no conflict of interest.
AUTHORSHIP CONTRIBUTION
Conceptualization: Bahar Asgarova, Elvin Jafarov, Nicat Babayev, Allahshukur Ahmadzada, Vugar Abdullayev, Yitong Niu.
Investigation: Bahar Asgarova, Elvin Jafarov, Nicat Babayev, Allahshukur Ahmadzada, Vugar Abdullayev, Yitong Niu.
Methodology: Bahar Asgarova, Elvin Jafarov, Nicat Babayev, Allahshukur Ahmadzada, Vugar Abdullayev, Yitong Niu.
Drafting - original draft: Bahar Asgarova, Elvin Jafarov, Nicat Babayev, Allahshukur Ahmadzada, Vugar Abdullayev, Yitong Niu.
Writing - proofreading and editing: Bahar Asgarova, Elvin Jafarov, Nicat Babayev, Allahshukur Ahmadzada, Vugar Abdullayev, Yitong Niu.