doi: 10.56294/dm2023140
ORIGINAL
Risk Analysis of Diabetic Leg Amputation : A Systematic Study
Análisis del Riesgo de Amputación de la Pierna Diabética: Un Estudio Sistemático
Sri Lalitha Y1 ![]() *, Gayatri P2 *, Laxmi Bindu I1 *, Ganapathi Raju1
*, Gayatri P2 *, Laxmi Bindu I1 *, Ganapathi Raju1 ![]() *
*
1Gokaraju Rangaraju Institute of Engineering and Technology, Department IT. Hyderabad, India.
2KIMS Hospital, Junior consultant, Department of Plastic Surgery. Hyderabad, India.
Cite as: Sri Lalitha Y, Gayatri P, Laxmi Bindu I, Ganapathi Raju. Risk Analysis of Diabetic Leg Amputation : A Systematic Study. Data and Metadata. 2023;2:140. https://doi.org/10,56294/dm2023140
Submitted: 16-08-2023 Revised: 31-10-2023 Accepted: 29-12-2023 Published: 30-12-2023
Editor: Prof.
Dr. Javier González Argote ![]()
ABSTRACT
Diabetic Foot Ulcer is considered a critical complication of diabetes, characterized by injuries and frequent exposure of the diabetic patient’s foot. Approximately 20 % of diabetic patients may develop foot ulcers, with around 10 % requiring hospitalization due to additional complications. Typically, these ulcers affect individuals who have had diabetes for more than ten years. Neglecting or leaving Diabetic Foot Ulcers untreated can result in severe damage, leading to worsened infections and potentially necessitating amputation, often accompanied by multiple complications that may even result in mortality. Therefore, early prediction of foot-threatening risks is crucial to prevent worsening situations. In this work visualization methods are applied for a better understanding of the dataset to draw meaningful insights and to observe the behavior of amputation risks in diabetic patients. The feature values fluctuate, so selecting the best feature from a combination of statistical and graphical data analysis is not trivial. Data visualization techniques (data-driven approach), and statistical analysis were used to select important features, that lead to leg amputation. The Machine learning models were implemented to forecast foot ulcers depending on clinical outcomes. A predicted accuracy of 85 % is observed using Ensemble Methods.
Keywords: Machine Learning(ml); Diabetes; Foot Ulcers; Leg Amputations.
RESUMEN
La úlcera del pie diabético se considera una complicación crítica de la diabetes, caracterizada por lesiones y exposición frecuente del pie del paciente diabético. Aproximadamente el 20 % de los pacientes diabéticos pueden desarrollar úlceras en el pie, y alrededor del 10 % requieren hospitalización debido a complicaciones adicionales. Por lo general, estas úlceras afectan a individuos que padecen diabetes desde hace más de diez años. Descuidar o dejar sin tratar las úlceras del pie diabético puede provocar daños graves, agravar las infecciones y hacer potencialmente necesaria la amputación, a menudo acompañada de múltiples complicaciones que pueden incluso provocar la mortalidad. Por lo tanto, la predicción precoz de los riesgos que amenazan al pie es crucial para prevenir situaciones de empeoramiento. En este trabajo se aplican métodos de visualización para comprender mejor el conjunto de datos, extraer conclusiones significativas y observar el comportamiento de los riesgos de amputación en pacientes diabéticos. Los valores de las características fluctúan, por lo que seleccionar la mejor característica a partir de una combinación de análisis estadístico y gráfico de los datos no es trivial. Se utilizaron técnicas de visualización de datos (enfoque basado en datos) y análisis estadísticos para seleccionar las características importantes que conducen a la amputación de piernas. Los modelos de aprendizaje automático se aplicaron para predecir las úlceras del pie en función de los resultados clínicos. Se observa una precisión de predicción del 85 % utilizando métodos ensemble.
Palabras clave: Aprendizaje Automático(ml); Diabetes; Úlceras de Pie; Amputaciones de Pierna.
INTRODUCTION
Diabetes is a long-term condition that results in inadequate production of insulin in the body, leading to various complications, including foot ulcers. This condition can occur in both type 1 and type 2 diabetes patients. Type 1 diabetes is characterized by a complete lack of insulin secretion, necessitating the use of insulin injections for treatment. On the other hand, type 2 diabetes involves insufficient insulin production, although some insulin is still produced. In the case of type 2 diabetes, medication is often prescribed instead of insulin injections to manage the condition.
Long-standing high cholesterol, coupled with type-1 or type-2 diabetes, raises the risk of developing diabetic-related complications. Foot ulcers occur when a diabetic patient has injuries on his foot, which often remains exposed, especially on the sole. About 20 % of people with diabetes will experience foot ulcers, with approximately 10 % requiring hospitalization due to additional complications. Several factors contribute to the need for foot amputations. Amputation is necessary when a non-healing ulcer causes significant damage to the tissues and bones, leading to the removal of the foot or a part of the limb. The appearance of a foot affected by a diabetic foot ulcer can be seen in figure 1.
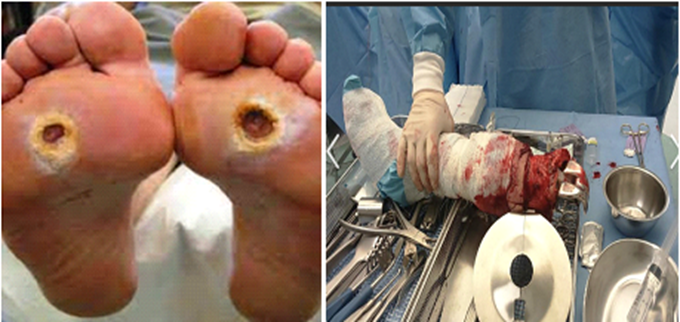
Figure 1. Affected foot with ulcers, below knee amputation
Detecting, diagnosing, and treating diabetic complications like foot ulcers at an early stage can help minimize the chances of experiencing additional problems and avoid worsening situations. Machine learning plays a significant role in healthcare by assisting doctors in identifying concerning conditions in patients at an early stage, allowing timely intervention and preventing adverse outcomes. Recent studies noticed the application of Machine Learning models to derive insights from data and predict accurately the disease and the treatment type. Applications of Machine Learning in the Healthcare domain benefit both Doctors and Patients as well.
Literature Survey
In Shiva et al.(1), Diabetes was detected using a polling method. The diabetes sample for Pima Indians was obtained from the UCI ML library. In this work, data mining methods such as decision trees, naive Bayes, Server Management Objects, Support Vector Machines, and Adaptive Boosting-M1 were used with a k-fold cross-validation strategy. By employing the polling method, the study identified the most effective algorithm out of the four, achieving an impressive overall accuracy of 95 %.
In Ahmed(2), a model was introduced to classify diabetes using historical medical data. The researchers utilized real-world data from the Health Facts database for this study. The algorithm developed in this research predicts whether a patient has diabetes or not, based on their HbA1C number, and determines if the diabetes level is in control or out of control. Data mining techniques, including Naive Bayes, logistic regression, and J48, were employed to construct the predictive model. Upon comparison, logistic regression (LR) emerged as the most effective method, exhibiting impressive performance metrics. LR achieved a total accuracy of 74,4 %, with high values for f-measure, precision, and recall, measuring 0,653, 0,73, and 0,744, respectively.
In Sneha et al.(3), the prediction of diabetes was explored using a dataset obtained from the machine learning library at the University of California, Irvine. A feature selection method was employed, utilizing the correlated values of the dataset’s attributes. Several algorithms, including the k-nearest neighbor, naive Bayes, random forest, and decision tree, were then applied to the selected features. Among these algorithms, the naive Bayes method outperformed the others, achieving an accuracy of 82,3 % in predicting diabetes.
From Caero et al.(4), it is identified and analyzed that a load cell method is used to treat foot sores. Load cells are sensors that are embedded into the foot pad. A support Vector Machine was used to analyze sensor data and got approximately 94,6 % accuracy and 95,2 % precision.
In Ogolodom et al.(5), the analysis and prediction of diabetes were conducted using various machine learning (ML) techniques. A dataset provided by a diabetes medical care center was utilized, and algorithms such as gradient boosting, logistic regression, adaptive boosting, random forest, and decision tree, were applied. Among these methods, gradient boosting performed the best, achieving an accuracy of 0,665 and an f-measure of 0,783.
In Sudarvizhi et al.(6), research was conducted to predict diabetes using “Associated Machine Learning Techniques based on Diabetes Based Predictions.” The focus was on developing an application that could detect or predict whether an individual is affected by diabetes based on their laboratory results. The primary objective was to achieve higher accuracy in disease prediction by employing various machine learning algorithms. Through the use of a Self-Organizing Map (SOM)-principal component analysis, an accuracy of 92,28 % was achieved in predicting diabetes.
Shiva et al.(7) has made predictions on diabetes using machine learning techniques and also to identify polygenic diseases. Developed a model using various techniques to gain accuracy of the forecasted data, the “Diabetes Prediction Using Different Machine Learning Approaches”. Support vector machine produced results with 82 % accuracy compared to another algorithm.
In Manoj Kumar et al.(8), machine learning and deep learning techniques were employed to predict diabetes within the context of a decision support system. The study titled “A Decision Support System for Diabetes Prediction Using Machine Learning and Deep Learning Techniques” highlights the effectiveness of Random Forest in diabetes prediction. With an accuracy of 83 %, Random Forest outperformed other techniques and proved to be more valuable in accurately categorizing diabetes.
In Priyanka et al.(9), the prediction of diabetes was conducted using the PIDD (Pima-diabetes disease diagnosis) method, employing a multilayer neural network trained with the Lavenberg-Marquardt algorithm. The study, titled “A Comparative Study on Diabetes Disease Diagnosis Using Neural Networks,” compared the classification results obtained from 10-fold cross-validation and traditional validation approaches. Interestingly, slight differences in the classification outcomes were observed for the same methods utilized in this research.
A system was built by Yahyaoui et al.(10) that can do early diabetes prediction for a patient with improved accuracy using the Random Forest algorithm in machine learning technology.
In Hasan et al.(11), the prediction of diabetes onset was performed using a technique that combines five commonly used classifiers in ensembles. The results obtained from these classifiers were aggregated using a meta-classifier. The study compared these findings with previous research conducted on the same dataset. The results showed that the proposed strategy achieved an accuracy of 83 % in predicting the onset of diabetes.
In Hernández-Flórez(12), the focus was on predicting diabetes using the Pima India Diabetes dataset. The research proposed a Diabetes Prediction Using a Machine Learning Methods approach, employing three supervised machine learning techniques: SVM, KNN, and Logistic Regression. However, it was found that the random forest classifier outperformed all other classifiers, achieving an impressive accuracy rating of 83,11 %.
The primary goal of data mining for Quiroz et al.(13) was to collect data from databases and transform those data into useful knowledge. The utilization of data mining technologies in the healthcare industry was the major emphasis of this study. In this study, a model for the intelligent prediction of diabetic disease was created. Using a dataset of diabetic individuals, this model examined the diabetes condition. Using the dataset of diabetic patients, the Bayesian and KNN (K-Nearest Neighbour) data mining methods were applied. For the purpose of evaluating the effectiveness of these two algorithms in predicting diabetes, a number of characteristics of diabetes were collected from the dataset.
VijiyaKumar et al.(14) proposed the prediction of diabetes using machine learning algorithms and applied six different machine learning algorithms in a study on the prediction of diabetes using artificial intelligence in healthcare. The effectiveness and precision of the used algorithms are discussed and contrasted. Linear regression, Random Forest, and Gradient boosting with weighted average values produced results that were respectively 79 %, 87 %, and 89 % when the various machine learning techniques used in this study were compared.
Nnamoko et al.(15) study in the presented case, the growing usage of smartphone apps in the management of type-2 diabetes has empowered patients to oversee their blood sugar levels independently. However, it’s worth mentioning that not all apps are universally applicable. This circumstance prompted an investigative effort with the goal of creating a diabetes-focused app tailored to offer assistance. The primary emphasis was placed on patient engagement and the integration of essential features within the app. To accomplish this, insights were extracted from experts, patients, and family members. These insights formed the basis for the development of a dedicated mobile app for type-2 diabetes, known as T2DM. Post-development, the app underwent thorough assessment involving medical experts and patients alike. The findings from the study accentuate the importance of involving users throughout the development journey to ensure optimal performance. Notably, the research highlights the pivotal role of nutritional information and functionalities related to blood sugar monitoring and health data exchange.
In Joshi et al.(16) significance of researching chronic diseases is amplified by their increasing global prevalence. One example is diabetes, arising from inadequate insulin production or utilization, leading to elevated blood sugar levels and severe complications including heart disease, stroke, neuropathy, blindness, kidney failure, and mortality. Accurate diagnosis is crucial for effective diabetes management, as an incorrect diagnosis can extend treatment, raise costs, and heighten patient risks. This study introduces an innovative method to determine optimal testing sequences, aiding medical decisions. It involves creating a chromosome population, each with a binary decision tree—a prime solution. The system’s efficacy is proven by a 95,4 % accuracy rate when applied to 50 patients.
Deeraj et al.(17) states that amid the current global landscape, diabetes has gained prominence as a hazardous condition, prevailing worldwide including in India, impacting various age groups due to factors such as lifestyle, genetics, stress, and aging. Despite its causes, undetected diabetes can lead to severe consequences. Multiple methods exist to predict diabetes and related disorders. This study employs Machine Learning techniques—Support Vector Machine (SVM) and Random Forest (RF)—to foresee Diabetes-Related Diseases. The process involves data pre-processing and the selection of influential features through stepwise and backward methods. The effectiveness of Principal Component Analysis (PCA) for dimensionality reduction is also explored post-feature selection. The culmination of this analysis yields an impressive 83 % prediction accuracy with Random Forest (RF), notably surpassing Support Vector Machine (SVM) accuracy at 81,4 %.
In Faruque et al.(18) the use of Wireless Body Area Networks (WBANs), comprising intelligent sensors and low-power actuators within the body, offers real-time physiological data for improved quality of life. These networks hold the potential to save lives, reduce healthcare costs, and eliminate the need for extensive hospital monitoring. This paper explores integrating IoT technology, communication standards, cloud solutions, and hardware components to develop an insulin monitoring system for diabetes patients. It introduces an algorithm and model for designing an insulin-level sensor network using IoT-based simulation software. The cloud-based architecture notifies healthcare centers about patients’ diabetic conditions. Simulation tests confirm the system’s efficacy in providing reliable results for early diagnosis and complication prevention, making it a practical solution for diabetes management.
Literature survey demonstrates Machine Learning Models to accurately identify whether a patient is diabetic or not. The primary objective of our current research is to study the characteristics of individuals who have both diabetes and foot ulcers. Additionally, we aim to create a model that is tailored to clinical diabetic conditions and extremities, specifically targeting patients who have previously undergone leg amputation and those who are at risk of experiencing diabetic foot amputations. This model is designed to predict the severity of foot ulcers, potentially leading to below-knee amputations.
To achieve these objectives, we will utilize data visualization and feature exploration techniques to identify the specific factors that play a significant role in the occurrence of diabetic foot amputations.
METHODS
This section details the research study figure 2 depicts the architecture of the study. The Process begins with desired data collection with required preprocessing. Data Visualization is applied to better understand the dataset and derive meaningful insights. To predict accurate treatment type, Machine Learning Techniques were modeled. The dataset is divided into Training and Test sets. The test set is used to check the accuracy of the models.
Architecture
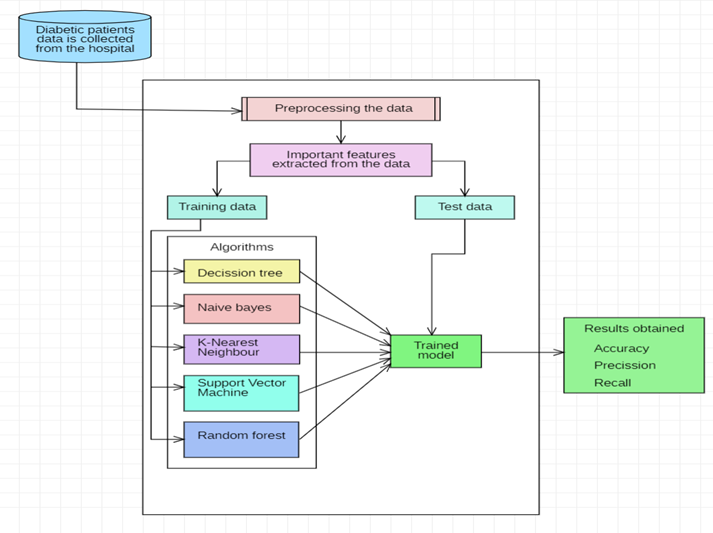
Figure 2. System Architecture
The architecture diagram starts with the desired data collection and the data has undergone pre-processing. The dataset contains descriptive data analysis and these were transformed to numerical values, for a better understanding of the dataset. The visualization analysis was carried out on the preprocessed dataset from which meaningful insights were drawn. Visualization helps in the deep understanding of the behavior of data points. The selected features and the combinations were further used to obtain the desired result.
The dataset is further divided into training and testing sets for building the model using different machine-learning algorithms. The built model was tested for unknown data (testing dataset) and accuracy was obtained.
Dataset
The dataset collected is real-time data with the help of Doctor Gayatri. The dataset is composed of 18 attributes and 150 instances, of which the target variable indicates the treatment types for diabetic patients with foot ulcers. The treatment type is an ordered multi-class variable, with “Debridement” being the mild condition of treatment, while “Bk-Amputation (below the knee) is the severe condition.
|
Table 1. The dataset collected |
||
|
S. No. |
Attributes |
Description |
|
1 |
Serial number |
To maintain confidentiality names of the patients are replaced with serial numbers |
|
2 |
Age |
Age of the person |
|
3 |
Sex |
The gender of the person is denoted as female or male |
|
4 |
Smoking |
The smoking status of a person is denoted as |
|
5 |
Duration of DM |
Duration of DM is denoted in years: 1-year, 2-year |
|
6 |
HbA1c |
3 months blood sugar graph where <6,5-1, >6,5-2 |
|
7 |
Therapeutic footwear |
Therapeutic footwear of a person is denoted as No or Yes |
|
8 |
H/O Trauma |
H/O trauma of a person is denoted as Absent, Present |
|
9 |
Culture |
The observed foot wound culture is denoted as follows- S.aureus, Streptococcus, E.coli, Klebsiella, Proteus, Pseudomonas, Others |
|
10 |
Ulcer & gangrene |
It contains a description of the condition of the ulcers and gangrenes that appeared on the foot. A numerical value is assigned by taking severity into consideration |
|
11 |
Wagener Class |
Wagner classes range from class1-class5 |
|
12 |
S. Creatinine |
Creatinine is denoted as – <1,2mgs% or >1,2mgs% |
|
13 |
Peripheral pulses |
PP of a person is denoted absent or Present |
|
14 |
ABI |
ABI of a person is denoted as Normal or Abnormal |
|
15 |
Peripheral neuropathy |
The PN of a person is denoted as Negative or Positive |
|
16 |
Previous intervention |
PI of a person is denoted as No or Yes |
|
17 |
Angioplasty |
Angioplasty of a person is denoted as No or Yes |
|
18 |
Treatment given |
Debridement, I&D Debridement, Debridement & SSG, Disarticulation, Debridement & Disarticulation, BK Amputation |
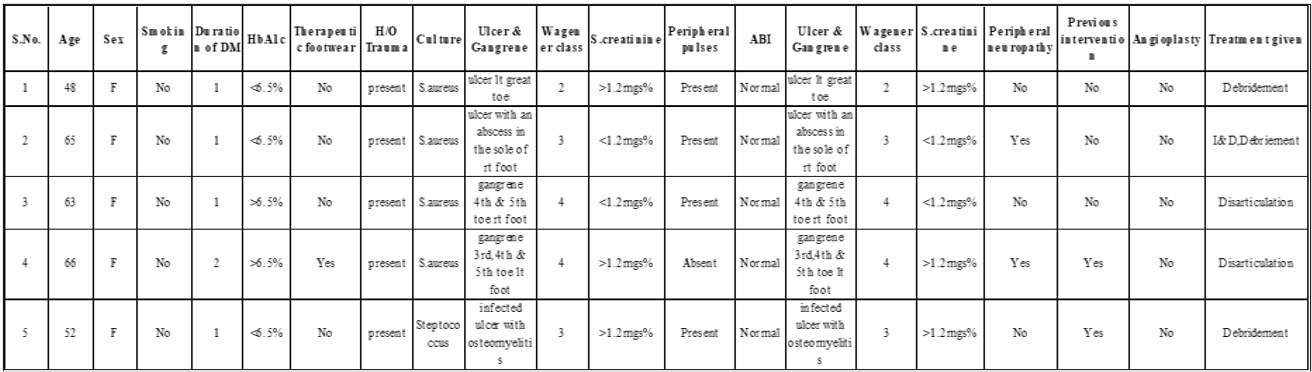
Figure 3. Sample Dataset
RESULTS
Exploratory Data Analysis
Different plotting techniques were used for a better understanding of the dataset. The main objective of this analysis is to find out the cases, nearest to the worst condition and identify the factors that are showing a huge impact so that their condition will become even more vulnerable. Figure 4 “Ratio of treatment types of the dataset” is seen in the pie chart, going to visualize the data distribution and count of the dataset with respect to the treatment type and one can easily interpret the percentage of instances falling in each category of the target variable. Enabled to analyze the severe conditions categories with the rest of the categories. It is determined that features such as Duration of DM, HbA1c, Culture, Ulcer &Gangrene, Wagener class, s. Creatinine and neuropathy are considered to be diabetic complications, which may fall into the category of “Amputation”.
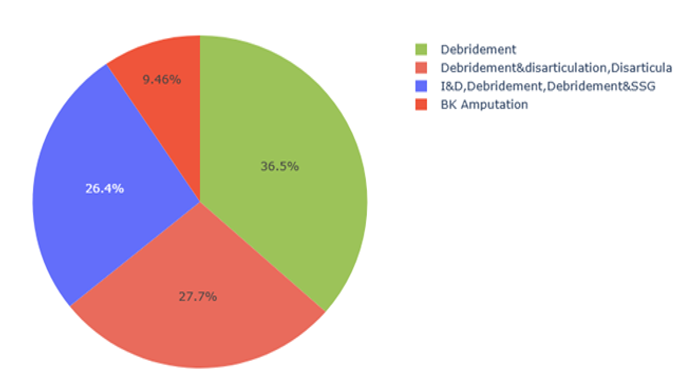
Figure 4. Percentage of instances based on Treatment type
The seaborn plot is considered the finest plotting method for visualization. In this work, it is used for mapping the dataset onto numerous axes in a grid of rows and columns and to observe the behavior of the variable with respect to the target variable. The impact of certain factors will be neutral on the other hand some factors will tend to increase the severity. Analyzing the factors concerning the target class with the highest risk is essential. It is observed from figure 5 that the severity is stable below grade 2 for ulcer & gangrene, the moment it is exceeding its value above 2 it will fall into risk condition and is clearly i.e., observed in both the cases of disarticulation and amputation.
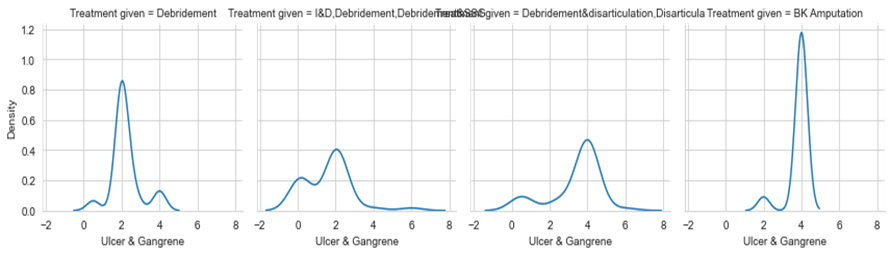
Figure 5. Ulcer & Treatment VS Treatment Type
The grade of figure 6 goes up because when the Duration of Diabetes Mellitus (DM) increases, the seriousness also goes up slowly. If someone has diabetes for more than a year, their blood sugar levels will rise, causing insulin resistance and problems that may lead to amputation.
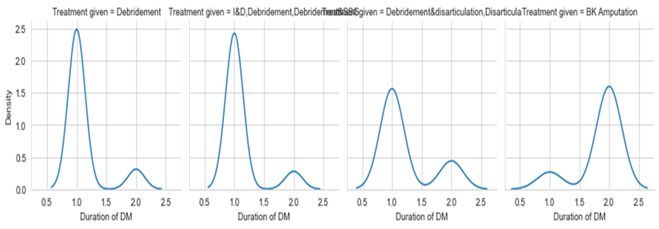
Figure 6. Duration of Diabetic Mellitus VS Treatment Type
From figure 6 it can be observed that with the increase in the Duration of Diabetes Mellitus(DM) values the severity will also increase gradually. If the duration is above one year the blood glucose levels will increase which will result in insulin resistance and cause related problems leading to amputation.
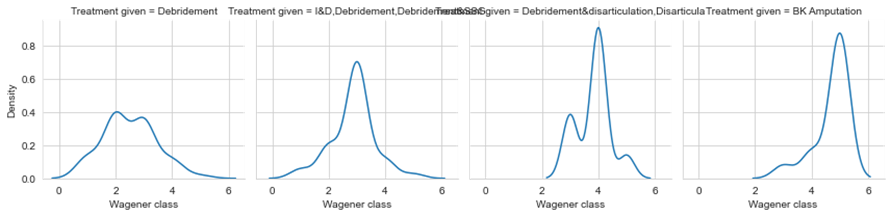
Figure 7. Wagener Class VS Treatment Type
‘Wagener’ is a tool that is used to scale the diabetes foot ulcer. Depending upon the wounds and their severity they are assigned the classes. The grades normally range from 0-6. It can be observed from figure 7. If the class is 2 and below, it will have less effect, and if it is above class 2 the risk will increase accordingly. This Wagener class will help to identify the cases that are likely to fall into the risk category. This feature identifies the amputation cases in advance to take appropriate measures.
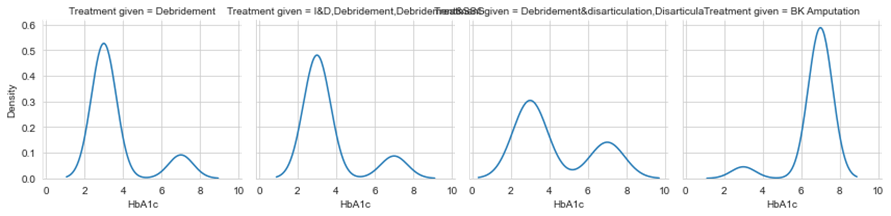
Figure 8. HbA1c VS Treatment Type
The HbA1C (Haemoglobin A1C) is a blood test that shows the average blood glucose levels over the past 3 months. If it is <6,5mg is normal and >6,5mg is abnormal. It can be noticed from figure 8, abnormal HbA1C readings in High-risk treatment type bk-amputation. Heterotopic ossification is a traumatic condition that occurs in response to deep injuries. This is frequently observed in diabetic patients whose Diabetes Mellitus(DM) duration is more than 2 years. If the trauma is present and due to other factors the injuries are in worsening condition.
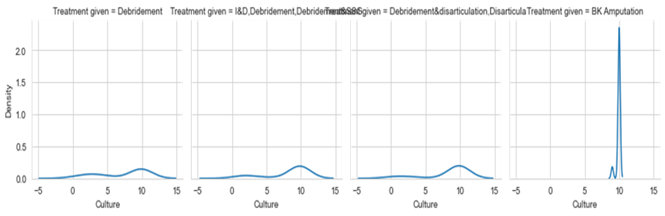
Figure 9. Metric Culture VS Treatment Type
To identify incidents of amputation, the metric culture is crucial. Since Klebsiella is a kind of bacterium that resides inside the human body, it has been noted that amputations account for a greater proportion of Klebsiella cases. Figure 9 depicts, the amputation class, for metric culture values of more than 5. The following severity ranges are provided: Steptococcus = 2, E.coli=3, Proteus = 5, Pseudomonas = 6, S. aureus = 8, and Klebsiella = 10.
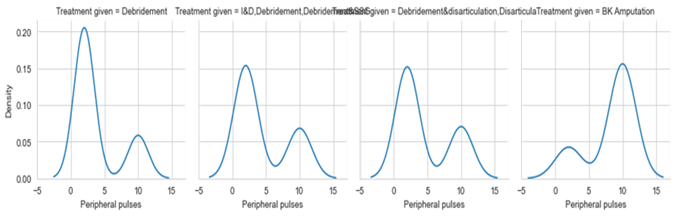
Figure 10. Peripheral pulse VS Treatment Type
Peripheral pulse is considered an important feature in detecting amputation. From figure 10, it is observed that if the pulses are present then they are considered to be non-amputation cases and if not they fall into amputation cases. The peripheral pulses with the status absent are mostly observed in amputated cases.
In summary, Data Visualization helped to draw the important features from the entire dataset for the amputated cases and also for the cases that might fall into the category of “BK Amputation” in the future, because using visual analysis is observed that “Debridement and disarticulations” cases are more likely to fall into the category of Amputation. Rest is less risky because the recovery rate is high for these cases. Though some feature combinations will not lead to the desired result but help to identify the behavior of the data points. For example ‘H/O Trauma’ is not acting as the deciding factor to get the result. But one of the features called ‘Wagener class’ will help to segregate.
To serve the purpose of this work some conditional statements were built to assign the correct class label to the respective record. The conditional statement is observed as follows:
|
Table 2. Algorithm or Sample Conditions for Below Knee Amputation |
|
# Sample conditions H_O_Trauma = 'Absent' HbA1c = '>6,5 %' Wagener_class = '3' Smoking = 'NO' # Treatment type based on conditions if H_O_Trauma == 'Absent' and HbA1c == '>6,5 %' and Wagener_class == '3' and Smoking == 'NO': treatment_type = 'BK Amputation' elif H_O_Trauma == 'Present' and HbA1c == '<6,5 %' and Wagener_class == '5' and Smoking == 'YES': treatment_type = 'BK Amputation' elif H_O_Trauma == 'Present' and HbA1 c == '>6,5 %' and Wagener_class == '4' and Smoking == 'YES': treatment_type = 'BK Amputation' elif H_O_Trauma == 'Present' and HbA1c == '>6,5 %' and Wagener_class == '4' and Smoking == 'NO': treatment_type = 'BK Amputation' elif H_O_Trauma == 'Present' and HbA1c == '>6,5 %' and Wagener_class == '4' and Smoking == 'YES': treatment_type = 'BK Amputation' else: treatment_type = 'Treatment not determined' |
|
Table 3. Algorithm or Sample conditions for Debridement & disarticulation |
|
# Sample conditions H_O_Trauma = 'Absent' HbA1c = '<6,5 %' Wagener_class = 'grade 4' Smoking = 'NO' # Treatment type based on conditions if H_O_Trauma == 'Absent' and HbA1c == '<6,5 %' and Wagener_class == 'grade 3' and Smoking == 'NO': treatment_type = 'Debridement & disarticulation' elif H_O_Trauma == 'Absent' and HbA1c == '<6,5 %' and Wagener_class == 'grade 4' and Smoking == 'NO': treatment_type = 'Debridement & disarticulation' elif H_O_Trauma == 'Absent' and HbA1c == '<6,5 %' and Wagener_class == 'grade 5' and Smoking == 'NO': treatment_type = 'Debridement & disarticulation' elif H_O_Trauma == ‘Absent’ and HbA1c == ‘>6,5 %’ and Wagener_class == ‘grade 4’ and Smoking == ‘NO’: treatment_type = ‘Debridement & disarticulation’ |
|
elif H_O_Trauma == ‘Absent’ and HbA1c == ‘>6,5 %’ and Wagener_class == ‘grade 4’ and Smoking == ‘YES’: treatment_type = ‘Debridement & disarticulation’ elif H_O_Trauma == ‘Present’ and HbA1c == ‘<6,5 %’ and Wagener_class == ‘grade 3’ and Smoking == ‘NO’: treatment_type = ‘Debridement & disarticulation’ elif H_O_Trauma == ‘Present’ and HbA1c == ‘<6,5 %’ and Wagener_class == ‘grade 3’ and Smoking == ‘YES’: treatment_type = ‘Debridement & disarticulation’ elif H_O_Trauma == ‘Present’ and HbA1c == ‘<6,5 %’ and Wagener_class == ‘grade 4’ and Smoking == ‘NO’: treatment_type = ‘Debridement & disarticulation’ elif H_O_Trauma == ‘Present’ and HbA1c == ‘<6,5 %’ and Wagener_class == ‘grade 5’ and Smoking == ‘NO’: treatment_type = ‘Debridement & disarticulation’ elif H_O_Trauma == ‘Present’ and HbA1c == ‘<6,5 %’ and Wagener_class == ‘grade 5’ and Smoking == ‘YES’: treatment_type = ‘Debridement & disarticulation’ elif H_O_Trauma == ‘Present’ and HbA1c == ‘>6,5 %’ and Wagener_class == ‘grade 3’ and Smoking == ‘NO’: treatment_type = ‘Debridement & disarticulation’ elif H_O_Trauma == ‘Present’ and HbA1c == ‘>6,5 %’ and Wagener_class == ‘grade 4’ and Smoking == ‘NO’: treatment_type = ‘Debridement&disarticulation’ elif H_O_Trauma == ‘Present’ and HbA1c == ‘>6,5 %’ and Wagener_class == ‘grade 5’ and Smoking == ‘NO’: treatment_type = ‘Debridement&disarticulation’ |
Model Building
Five Machine Learning algorithms were modeled to demonstrate the accuracy of prediction. Naïve Bayes is considered, for its performance in multi-class classification tasks. The decision Tree model is chosen for its best attribute selection in the classification task. KNN is a simple and effective algorithm in multi-class classification tasks, it classifies the unknown instance based on the similarity between this instance, and the instance already assigned to a class. SVM is used for finding an optimal hyperplane that maximally, separates the classes in the future scope. Random forest is a powerful ensemble learning method. It extends the concept of a decision tree to create an ensemble of multiple trees and combine their predictions to make the final classification decisions.
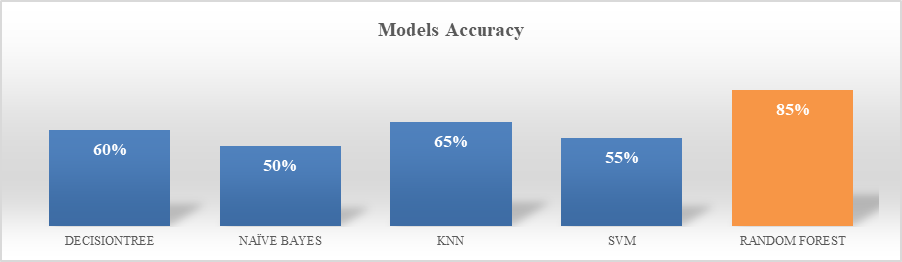
Figure 11. Machine learning models Accuracy
Figure 11 depicts the accuracy of risk prediction. It is observed that Random Forest exhibited 85 % accuracy in prediction.
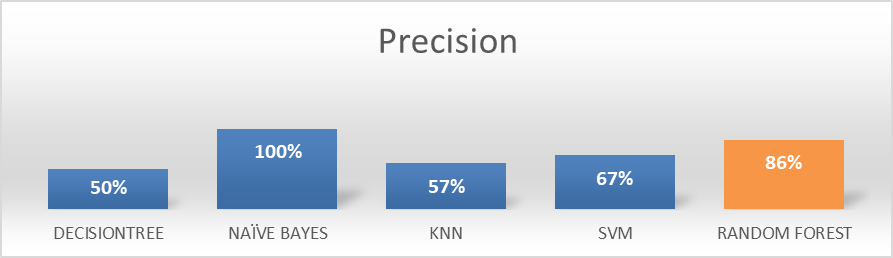
Figure 12. Machine learning models Precision
Figure 12 demonstrates the ability of the models to predict the instances with exactness. The percentage of instances that the classifier classified is exactly correct is observed in NaiveBayes and Random Forest demonstrated a high percentage of correctness.
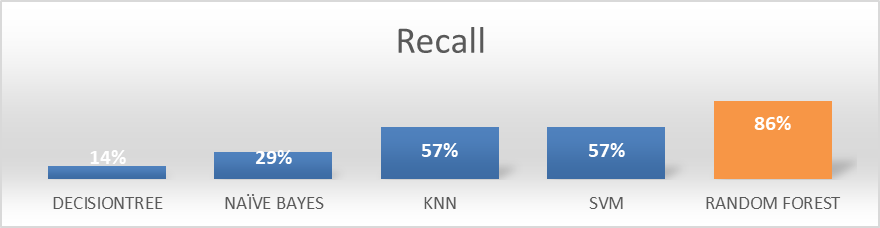
Figure 13. Machine Learning Models Recall
Figure 13 is the Recall Chart, which demonstrates the completeness of the instances classified correctly, Random forest is showing 86 %.
DISCUSSION
A critical review of this study is carried out with the primary objective of analyzing the clinical outcomes of the data. Visualizing the data points will help to observe the behavior of the data points. Features such as Duration of DM, HbA1c, Culture, Ulcer &Gangrene, Wagener class, s. Creatinine and neuropathy are diabetic complications. The work here provides useful insights and the features that should be taken into account especially in assessing the conditions for BK Amputation, Debridement and Disarticulation.
Results should be made in the light of the work published by international and national researchers. Do not fail to point out or hide unresolved aspects, as this practice is unscientific. Point out aspects that do not coincide with other authors and explain possible differences. The discussion should be relevant and brief, avoiding prolixity. The data presented should support the authors’ interpretations and conclusions. The limitations of the study should be stated.
CONCLUSIONS
This study reviewed the literature on diabetes prediction and detection using a variety of machine-learning techniques. Most of the publications employed the SVM method, which exhibits varying degrees of accuracy with various diabetic datasets, according to the conclusions and literature review from the journal papers. However, this study is carried out with the primary objective of analyzing the clinical outcomes of the data. Visualizing the data points will help to observe the behavior of the data points.
It has provided useful insights about the dataset, and the features that influence treatment type. Features such as Duration of DM, HbA1c, Culture, Ulcer &Gangrene, Wagener class, s. Creatinine and neuropathy are diabetic complications. In this current work, the system was put into use on a dataset of 18 parameters using the ensembling random forest method, and it was discovered that it works flawlessly with this dataset and provides a decent accuracy of around 85 %. To early identification of potential issues, this research outcome might potentially be included in the medical healthcare system. The effectiveness of this model may be greatly improved by gathering a larger dataset. The dataset has fewer characteristics. Since the model’s efficiency still needs to be increased, even when the accuracy is high. Additionally, precision is important and is utilized to build the model.
A medical issue’s complicating factor is the number of false negative and false positive results. False negatives are a significant factor, especially in our case, as they may result in the patient’s death. We can balance the dataset such that it has more positive classes to address this. The number of false positive tests may rise as a result, although false positive tests are just bothersome to patients, false negative tests have the potential to be fatal. To improve the accuracy present work can be extended to image processing where more clinical information is used to depict the outcomes.
REFERENCES
1. R. Shiva, R. Rajender & S. Nilambar, “A data mining scheme for detection and classification of diabetes mellitus using the voting expert strategy”, International Journal of Knowledge-based and Intelligent Engineering Systems, vol.23, no.2, pp.103-108, 2019.
2. T. M Ahmed, “Using data mining to develop a model for classifying diabetic patient control level based on historical medical records”, Journal of Theoretical and Applied Information Technology, vol.87(2), pp.316-323, 2016.
3. N. Sneha & G. Tarun. “Analysis of diabetes mellitus for early prediction using optimal features selection”, Journal of Big Data, vol.6(13),2019.
4. Caero L, Libertelli J. Relationship between Vigorexia, steroid use, and recreational bodybuilding practice and the effects of the closure of training centers due to the Covid-19 pandemic in young people in Argentina. AG Salud 2023;1:18-18.
5. Ogolodom MP, Ochong AD, Egop EB, Jeremiah CU, Madume AK, Nyenke CU, et al. Knowledge and perception of healthcare workers towards the adoption of artificial intelligence in healthcare service delivery in Nigeria. AG Salud 2023;1:16-16.
6. D. Sudarvizhi, R. Nivetha, P. Priyadharshini & J.R. Swetha “Identification and Analysis of Foot Ulceration using Load Cell Technique”, International Research J. of Engineering and Technology (IRJET), vol. 6(3), pp.7792-7797, 2019.
7. Shiva, R. Shiva, R. Rajender & S. Nilambar, “A Comprehensive Analysis of Machine Learning Techniques for Incessant Prediction of Diabetes Mellitus”, International J. of Grid and Distributed Computing, vol.13(1), pp.1-22 2020.
8. P. Manoj Kumar, K. V. S Haswanth, G. Mahidhar Swaroop, M.J.P Priyadarsini, “Associated Machine Learning Techniques based On Diabetes Based Predictions”, International Conference on Intelligent Computing and Control Systems, pp. 1445-1450, 2019.
9. S. Priyanka, K. Jayamalini, “Diabetes Prediction Using Different Machine Learning Approaches”, Proceedings of the Third International Conference on Computing Method-ologies and Communication IEEE, pp.367-371, 2019.
10. A. Yahyaoui, A. Jamil, J. Rasheed, M. Yelliepe, “Decision Support System for Diabetes Prediction Using Machine Learning and Deep Learning Techniques”, 2019 1st International Informatics and Software Engineering Conference (UBMYK), 2019.
11. T. Hasan, Y. Nejat, T. Feyzullah, “A comparative study on diabetes disease diagnosis using neural networks”, vol. 36, pp.8610–8615 Expert Systems with Applications –Elsevier, 2009.
12. Hernández-Flórez N. Breaking stereotypes: “a philosophical reflection on women criminals from a gender perspective”. AG Salud 2023;1:17-17.
13. Quiroz FJR, Oncoy AWE. Resiliencia y satisfacción con la vida en universitarios migrantes residentes en Lima. AG Salud 2023;1:09-09.
14. K. VijiyaKumar, B. Lavanya, I. Nirmala, S. Caroline, “Random Forest Algorithm for the Prediction of Diabetes”, IEEE International Conference on System, Computation, Automation and Networking (ICSCAN), pp. 1-5, 2019.
15. N. Nnamoko, H. Abir, E. David, “Predicting Diabetes Onset: An Ensemble Supervised Learning Approach”, IEEE Congress on Evolutionary Computation, pp.1-7,2018.
16. T. N. Joshi, P. M. Chawan, “Diabetes Prediction Using Machine Learning Techniques”, International Journal of Engineering Research and Application, Vol. 8, Issue 1, (Part -II) January 2018.
17. S. Deeraj, R. Kishor, S. Sohail, P. Nikita, “Diabetes Disease Prediction Using Data Mining”, International Conference on Innovations in Information, Embedded and Communication Systems, 2017.
18. Md. A. Faruque, I. Sarker, “Performance Analysis of Machine Learning Techniques to Predict Diabetes Mellitus”, International Conference on Electrical, Computer and Communication Engineering,7-9, February 2019.
19. O. Thinnukool, W. Orawit, P. Khuwuthyakorn, P. Wientong, B. Suksatit, & N. Waisa-yanand, “Type 2 Diabetes Mobile Application for Supporting for Clinical Treatment: Case Development Report”, International Journal of Online Engineering (iJOE), vol. 15, pp. 21-38. 2019.
20. S. Majdoleen & A. Baha & A. Abedalrahman & M. Abudalla & A. Mohammad. (2019). “Treatment of Diabetes Type II Using Genetic Algorithm”, International Journal of Online and Biomedical Engineering (iJOE), vol.15, pp. 53. 2019.
21. S. Sivaranjani, S. Ananya, J. Aravinth and R. Karthika, “Diabetes Prediction using Ma-chine Learning Algorithms with Feature Selection and Dimensionality Reduction”, 7th International Conference on Advanced Computing and Communication Systems (ICACCS), Coimbatore, India, pp. 141-146, 2021.
22. P. Martin & T. Filip, “Application of Sensor Networks for Measuring Insulin Levels”, International Journal of Online and Biomedical Engineering (iJOE), vol.16. 2020.
FINANCING
“None” or “The authors did not receive financing for the development of this research”.
CONFLICT OF INTEREST
“None” or “The authors declare that there is no conflict of interest”.
AUTHORSHIP CONTRIBUTION
Conceptualization: P. Gayatri, Y. Sri Lalitha.
Data curation : P. Gayatri, Laxmi Bindu I.
Formal analysis : P. Gayatri, Y. Sri Lalitha.
Acquisition of funds: xxxxxx.
Research: Y. Sri Lalitha, N V Ganapathi Raju, Lakshmi Bindu I.
Methodology: Y. Sri Lalitha, N. V. Ganapathi Raju..
Project management: Lakshmi Bindu I.
Resources: Github, Related Textbooks.
Software: Python.
Supervision: Y. Sri Lalitha.
Validation: P. Gayatri.
Display : Laxmi Bindu I.
Drafting - original draft: Laxmi Bindu , Y. Sri Lalitha.
Writing - proofreading and editing: P. Gayatri, N.V. Ganapathi Raju.