doi: 10.56294/dm2024.592
ORIGINAL
Revolutionizing Smart Agriculture: Enhancing Apple Quality with Machine Learning
Revolucionando la agricultura inteligente: Mejorar la calidad de las manzanas con el aprendizaje automático
Mehdi IYOUBI El1,2 ![]() *, Raja EL BOQ2,3
*, Raja EL BOQ2,3 ![]() , Kenza IZIKKI3,4
, Kenza IZIKKI3,4 ![]() , Samir TETOUANI2,3
, Samir TETOUANI2,3 ![]() , Omar CHERKAOUI5
, Omar CHERKAOUI5 ![]() , Aziz SOULHI1
, Aziz SOULHI1 ![]()
1National Higher School of Mines. Rabat, Morocco.
2Numerical Advanced Engineering Laboratory (LINA), Higher School of Textile and Clothing Industries. Casablanca, Morocco.
3LASTIMI Laboratory, Graduate School of Technology EST, Mohamed V University. Rabat, Morocco.
4Logistics Center of Excellence (CELOG), Higher School of Textile and Clothing Industries. Casablanca, Morocco.
5Laboratory for Research in Textile Materials (REMTEX), Higher School of Textile and Clothing Industries. Casablanca, Morocco.
Cite as: IYOUBI EM, EL BOQ R, IZIKKI K, TETOUANI S, CHERKAOUI O, SOULHI A. Revolutionizing Smart Agriculture: Enhancing Apple Quality with Machine Learning. Data and Metadata. 2024; 3:.592. https://doi.org/10.56294/dm2024.592
Submitted: 05-05-2024 Revised: 17-09-2024 Accepted: 27-12-2024 Published: 28-12-2024
Editor: Adrián
Alejandro Vitón Castillo ![]()
Corresponding Author: Mehdi IYOUBI El *
ABSTRACT
Agriculture 4.0 is a field that has spread widely around the world in this century, as it has undergone an exceptionally rapid evolution, especially when it comes to fruit recognition.
Decisions about their quality are crucial to maximize profits and meet customer expectations. In the past, apples or even other fruits were based solely on visual assessments by experts, which led to errors. These old methods no longer consider the genetic evolution of apples, as they only consider their size, color, and skin imperfections. Digitizing this process saves energy and reduces costs and human error as well. Recent technological advances, which combine AI and CAO at the same time for fruit sorting, make it possible to achieve high levels of quality and meet the growing challenges of food safety on a global scale. This study proposes a machine learning-based multiclass model to improve the accuracy and efficiency of apple quality assessment. The model is trained on a large image dataset of three apple varieties: Gala, Fuji, and Golden Delicious (G.D). The model automatically classifies apples based on attributes such as color, shape, and imperfections, and evaluates their conformity. Experimental results demonstrate the effectiveness of this model, which achieves 97 % accuracy in identifying apple varieties and assessing their quality. This approach significantly reduces inspection time and errors, optimizing operations in the production chain.
Keywords: Agriculture 4.0; Artificial Intelligence;
Convolutional Neural Network; Image Processing; EfficientNet; Quality.
RESUMEN
Agricultura 4.0 es un campo que se ha extendido mucho por todo el mundo en este siglo, ya que ha experimentado una evolución excepcionalmente rápida, sobre todo en lo que se refiere al reconocimiento de las frutas.
Las decisiones sobre su calidad son cruciales para maximizar los beneficios y satisfacer las expectativas de los clientes. En el pasado, las manzanas o incluso otras frutas se basaban únicamente en evaluaciones visuales de expertos, lo que daba lugar a errores. Estos métodos antiguos ya no tienen en cuenta la evolución genética de las manzanas, ya que sólo tienen en cuenta su tamaño, color e imperfecciones de la piel. Digitalizar este proceso permite economizar energía, reducir los costes y los errores humanos tambien. Los recientes avances tecnológicos, que combinan AI y CAO al mismo tiempo para la clasificación de la fruta, permiten alcanzar altos niveles de calidad y hacer frente a los crecientes retos de la seguridad alimentaria a escala mundial. Este estudio propone un modelo multiclase basado en el aprendizaje automático para mejorar la precisión y la eficacia de la evaluación de la calidad de las manzanas. El modelo se entrena con un amplio conjunto de datos de imágenes de tres variedades de manzana: Gala, Fuji y Golden Delicious (G.D). El modelo clasifica automáticamente las manzanas en función de atributos como el color, la forma y las imperfecciones, y evalúa su conformidad. Los resultados experimentales demuestran la eficacia de este modelo, que alcanza una precisión del 97 % en la identificación de variedades de manzanas y la evaluación de su calidad. Este enfoque reduce significativamente el tiempo y los errores de inspección, optimizando las operaciones de la cadena de producción.
Palabras clave: Agricultura 4.0; Inteligencia Artificial; Red Neural Convolucional; Tratamiento de Imágenes; EfficientNet; Calidad.
INTRODUCTION
Precision farming plays a crucial role in global economic growth. Recently, this technique has been widely adopted, boosting productivity and making farmers smarter and more connected.(1) The global economy relies heavily on agriculture, and the market value of smart agriculture is projected to grow from 150 billion Moroccan Dirham (MAD) (approximately 15 billion USD) in 2022 to 330 billion MAD (approximately 33 billion USD) by 2027.(1,2)
Morocco, a country with diverse agricultural products, in increasingly relying on agriculture alongside other sectors such as fishing, phosphate, textiles, and automobiles.(3) Apples are the third largest fruit produced in Morocco, following dates and olives.(4)
Globally, apple production exceeded 93 million tons in 2021, marking a 3 % increase from the previous year.(5) Apple varieties such as GALA, FUJI and Golden Delicious are favored worldwide due to their shape, long shelf-life and flavor.(6) Among the world's top twenty apple producers, Morocco takes place. It makes a significant contribution to the global fruit market. It is also the third- biggest producer in the African continent, notably in the areas of Fès-Meknès and the Atlas Mountains.(7)
Moroccan agriculture is mainly based on apple production, which provides more than 60 000 jobs and 2,2 million working days every year.(8) Fuji, Golden Delicious (GD) and Gala represent three of the most common apple varieties worldwide. On the other hand, classic apple recognition techniques are time-consuming, error-prone and hard to differentiate between similar varieties such as Fuji and Gala.
Consequently, it is necessary to combine artificial intelligence (AI) and machine learning (ML) to improve classification accuracy and efficiency. Convolutional neural networks (CNNs) have proven to be effective and powerful tools for image recognition and classification processes, and for fruit sorting. CNNs automate the process of learning appropriate features from images, removing the necessity for manual feature extraction.(9) The use of CNNs in agricultural applications, notably for fruit classification, has shown promising results both in terms of accuracy and efficiency. However, training CNNs demands large datasets to reduce errors and avoid overfitting.(10,11) This paper uses the EfficientNet architecture to train a model on a 2100-image dataset representing different apple varieties and compliance levels.
The important relationship between fruit quality, maturity, and conformity forms the basis of agriculture. This complex interaction provides indispensable insights for enhancing productivity and minimizing waste, guiding decisions from cultivation to post-harvest procedures at every stage.
This knowledge enables stakeholders to improve customer satisfaction and optimize supply chain efficiency.(12) Ultimately, the primary aim of this study is to ensure that the fruits produced meet consumers' expectations in the market.
This involves prioritizing sustainable farming practices and consistently delivering fruits of excellent quality at the ideal maturity level.(13) Ripeness, conformity, and the quality of fruits are some parameters that significantly influence the satisfaction of consumers.(14) These factors shape decisions regarding harvesting and market value.(14)
Therefore, Quality and ripeness are crucial because they ensure flavorful, nutritious fruits, maximize market value, reduce waste, optimize agricultural practices, and meet consumer expectations.(15) Fruit maturation, which refers to the phase in a fruit's growth characterized by both physiological and bio-chemical changes, is vital in identifying the fruit's suitability for harvesting and eating.(16)
This step ensures the best possible quality, taste and nutritive content. This procedure is closely related to fruit quality, because it identifies which fruits satisfy some standards or specifications in terms of taste, visual appearance and nutritive values. Fruits with higher qualities are usually classified in premium levels.(14)
In comparison, those with lower quality attributes may be categorized into lower grades and then could be used for other usage. Fruit conformity is the correspondence between the fruit's external appearance and its ripeness stage. Research has investigated fruit conformity parameters such as color, texture, and size.(17) Although visual inspection is often used as an initial indicator of maturity, it lacks consistency in accurately reflecting the true ripeness, which poses challenges in precise assessment harvesting.
Conventional techniques such as the numerical penetrometer measure fruit ripeness by deeply piercing the fruit, although this is wasteful and destroys fruit in the procedure.(18)
Other traditional methods, such as visual inspection and Brix refractometry, are common in the ripeness detection process but have many scientific restrictions. These methods demand considerable investment in time and labor, particularly in the case of large-scale agricultural applications.(19)
Manual techniques present a risk of physical damage to fruits due to frequent handling, which can affect overall quality and marketability.(20) The traditional methods for determining fruit conformity ought to be upgraded by technological developments.
Recent technological integration in agriculture has enhanced precision and productivity while complying with modern industrial standards. This alteration is crucial for satisfying the growing demands of global markets and making sure that industrialized production's high throughput is maintained in the quality control procedures.(10)
By developing these techniques, the agriculture industry could raise its standards of fruit consistency and excellence, raising customer satisfaction and competitive advantage.
The market's changing expectations and needs are not being effectively fulfilled by traditional approaches for fruit conformity detection. To attain higher precision, effectiveness, and compliance with current technology, these methods are urgently required.(21)
Fruit producers and wholesalers must maintain high standards in those fields considering it impacts the produce's nutritional value and flavor and compliance with regulations.(22) These elements not only affect the fruit's cost and market acceptance, but they also have an important effect on brand reputation and may influence the overall achievement of agricultural efforts. Therefore, fulfilling customer expectations and establishing successful company operations requires careful attention to fruit growth, harvesting, and quality.(23)
In the food and agricultural distribution sectors, the detection and classification of compliant produce are indispensable techniques that have a considerable impact on cost, brand image, and profitability. Conformity detection consists of analyzing fruit according to specific criteria, including size, shape, color, and defects to evaluate their quality and sort them appropriately.(24)
Smart Agriculture converts traditional production methods and universal farming strategies into a set of optimized agricultural practices using advanced technologies that stimulate innovative solutions at every stage of the agricultural cycle.
Due to the complexity of the changing farm ecosystem, the new technological revolution's benefits will not be shared evenly. It is necessary to understand the problems and challenges that need to be addressed so that all countries fully benefit from the potential of Agriculture 4.0.
Researchers(24,25,26) carried out a Systematic Literature Review based on the Protocol of Preferred Reporting Items for Systematic Reviews and Meta-Analyses. Through these studies descriptions, definitions, and a compilation of approaches related to agriculture 4.0 were presented. Technologies of agriculture 4.0, responsible for revolutionizing and impacting how commodities are produced, processed, traded, and consumed, were also surveyed. Moreover, the barriers that hinder the development of agriculture 4.0 and limit its progress are listed. The barriers were classified into five dimensions: technological, economic, political, social, and environmental. These are issues that need to be resolved in different areas to achieve a larger scale in countries looking to implement agriculture 4.0.
This research contributes to a specific aspect of the Implementation of smart agriculture. The process of detecting and classifying the fruits has an impact on the cost and sales, assuring that customers get appropriate products in line with their requirements. Efficient identification and classification of conformity also promotes optimal supply chain management, ensuring that products are shipped in accordance with quality demands.
Moreover, this connection is crucial for maintaining quality control throughout the distribution and production process, ensuring that all products comply with necessary guidelines and standards.(27)
It is important to acknowledge the vital role of accurate fruit classification, which requires categorizing fruits according to diverse parameters. This process involves the quality of fruits based on their texture, color, maturity, size, and shape, and it is essential for optimizing various stages of the agricultural supply chain, including harvesting, storage, distribution, and consumption.(28)
Agriculture 4.0, or as known smart agriculture, means using progressive technologies, and data analysis to improve agricultural operations, increase productivity, and boost crop yields. One envisaged benefit of using information and interconnection technology for this type of agriculture is the real-time collection and tracking of data through a multitude of wireless sensors and devices. IoT systems and Big Data analysis are frequently used for data collection, diagnostics, and monitoring in the precision crop sector.
Smart agricultural operations aim to increase the efficiency of inputs (temperature, humidity, water, fertilizer, seeds, etc.) for crops. This is achieved using sensors and actuators, which form part of the IoT nodes, to provide daily field monitoring,(29) hence, the extensive use of real-time data. This data is compiled, managed, and analyzed using various technologies to make useful insights.
The agricultural sector plays a pivotal role in human existence, providing livelihood opportunities for the majority of the population and contributing to the global economy.(30) The global population growth, economic development, and changes in consumer habits led to higher demand for livestock, food, textiles, and high-quality products.(31) The agricultural sector changed traditional techniques to increase production to satisfy the continuously increasing demand.
Through the evolution of the generation over the past decade, the trend has become even more at the forefront of technology. Some researchers have already warned of the technological trends that are transforming traditional agriculture into smart, which optimizes production based on various crop characteristics.(32)
Smart farming has incorporated systemic learning technologies and image processing to improve fruit class recognition and compliance. These improvements suggest non damaging alternatives that balance speed, accuracy and precision in fruit evaluation assessment.(33)
These technologies enable more accurate automated classification using advanced algorithms and high-resolution imaging. This method simplifies the assessment process, reduces reliance on manual labor, and minimizes the risk of subjective bias and errors. Moreover, ML algorithms continuously enhance their performance through iterative learning, improving the overall reliability and effectiveness of the fruit classification system.(34,35,36)
Recently, the importance attributed to intelligent agriculture and apple developing has been accentuated, especially in apple generating regions. The incorporation of sophisticated technologies which includes CAO, CNN and AI has marked an essential shift in apple categorization, outperforming previous techniques based on chemical, aspectual and textural attributes.(37) In the smart appliance quarter, there has been a notable transformation in fruit classification. AI algorithms now provide transcendent accuracy and efficiency to determine fruit conformity or quality exclusively based on image analysis and intelligent characteristics.
Advancements in evaluating Apple quality through AI have improved product quality, reduced errors, and minimized manual labor dependency.(38,39) Automated systems for apple quality evaluation ensure only high-quality apples reach consumers and export markets. Digitalizing fruit quality assessment integrates processes for accurate results, enhancing efficiency and technological advancement.
Some researchers have used the fuzzy logic approach based on image processing for smart agriculture using the four following parameters: color, size, shape, and defects to classify apples.(40)
This process has enabled AI to be combined with conventional industries to eventually fully reconstitute advanced processes such as clustering, anomaly detection, segmentation,(41) classification,(42) edge detection, precision adjustment(43) and apple ripeness recognition.(44)
Meanwhile, advances in AI have had a significant impact on agriculture. This paper(45) proposed a CNN model for efficient and rapid apple quality identification. It relies on image attributes and performs detection and classification, surpassing old methods in terms of accuracy, and after it achieved an overall accuracy of 95,33 % with a dataset of 300 apples. Therefore, this rate proves the robustness of the model in assessing apple quality through image processing.(45) Another study on the Fuji apple variety used a combination of color and shape features through SVM, giving an accuracy of 69,2 %.(46)
Models using CNNs showed superior accuracy in identifying apple varieties compared with traditional methods.(47) In the study(48), a CNN model was used to identify apple varieties and accurately distinguish between different types of apples, contributing to the development of a robust automated classification system. A study(49) highlights the progress made in real-time apple classification systems, illustrating the potential for improved efficiency in the agricultural sector. In 2022, research by Morshed Samin et al. focused on fruit quality detection using deep learning neural networks, providing a basis for advances in fruit quality control systems.(50) Moreover, an SVM model achieved 96 % accuracy in classifying six apple varieties,(51) while Naïve Bayes classified seven types of fruit with 95,27 % accuracy.(52)
Previous research referred to above has investigated various methods for fruit quality assessment based on ML and image processing. In this work, our research focuses specifically on the application of a CNN approach to classify apples of three different varieties according to predefined attributes, with the aim of guaranteeing compliance with international quality norms. Intelligent and automatic identification of apple quality using ML confirms its capability in supporting early decision-making for effective farm supervision. Our model is designed to distinguish between three apple varieties based on two distinct levels of quality to ensure export compliance.
METHOD
EfficientNet architecture was the origin of a multiclass strategy, a CNN conceptualization recognized for its accuracy and efficiency, even with smaller datasets, constitutes part of the proposed methodology. The following three primary phases constitute the process: collecting data, training the model, and measuring performance.
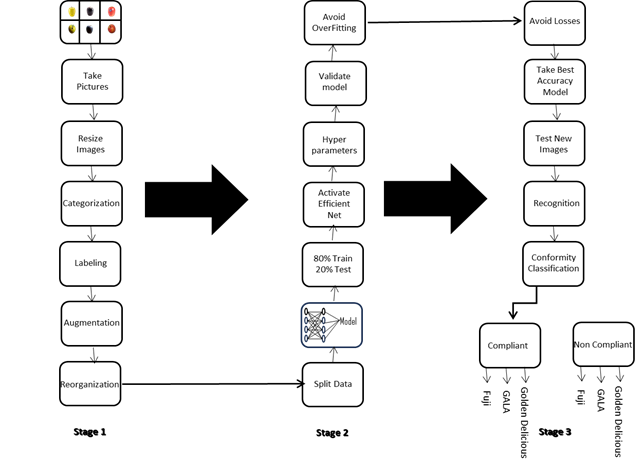
Figure 1. Overview of the methodological framework for Apple Quality Classification
The dataset was obtained by capturing pictures of the 3 most Moroccan-consumed apples: GALA, Golden Delicious (G.D), and FUJI.
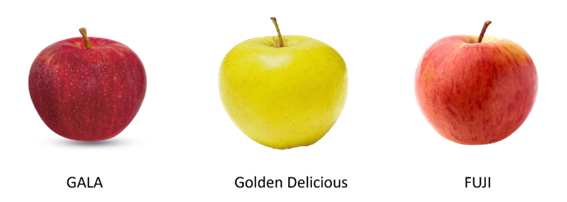
Figure 2. Examples of Labeled Apple Images Representing Three varieties
The primary goal of our study is to create a smart, accurate model for identifying apple quality. Predictions are made until all phases of the whole procedure. This decision-making methodology is a sort of supervised learning (CNN) that ensures consumers receive products of the highest quality, reinforcing confidence in the Moroccan agricultural industry.
Neural network architecture is crucial in machine learning, particularly when classifying six distinct fruit classes. These networks imitate the structure of the human brain, exhibiting proficiency in solving complex problems, such as fruit classification. Figure 3 illustrates the neural network architecture of our model.
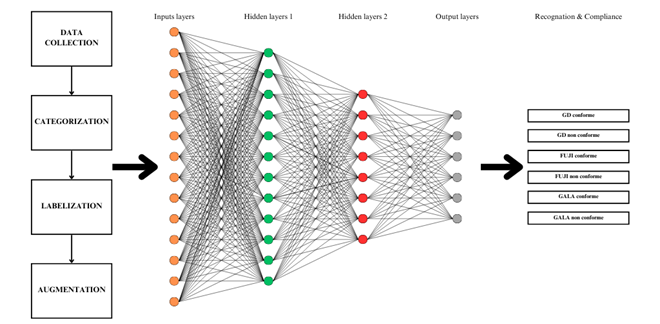
Figure 3. Neural Network Architecture for Multi-Class Apple Quality Classification
Data Processing
The process of pre-processing data for model training begins with the collection of raw data. In this case, this involves capturing and cleaning images to eliminate anomalies. Next, data augmentation is carried out to increase the diversity of examples available for training. This is done by introducing variations into existing images. After the data has been pre-processed, they are immediately split into two important steps: training and test sets at a ratio of 80/20. This enables the model's performance to be assessed on data it has never encountered during training. This process guarantees adequate preparation of the data for model training, maximizing the quality and diversity of the data available while ensuring a firm and accurate assessment of model performance. This is demonstrated in the figure 4:

Figure 4. Data Pre-processing Steps
Collecting Data
Manual fruit classification is prone to errors due to laborers' lack of awareness and expertise. To reduce human error and improve decision-making,(30) this image-processing method generates a new dataset for the machine to use, minimizing losses. Smart agriculture is gaining momentum due to AI and image classification using a specific architecture that can produce favorable results after training.
The images were captured using an iPhone 12 Pro Max with an efficient picture resolution: 2.8 K Full HD+ with 12 megapixels (2778×1284). The data was collected in HEIC format (High-Efficiency Image Container). The study captured around 50 images for each fruit model, both healthy and rotten, during the day and with a blue background to minimize the shadows.
Labeling Data
In this step, the first step of the work describes how the data was collected and then we define the target that we want the machine learning model to predict accurately. The training model must detect and predict the features with high reliability. In our case project, each image in the database would be labeled with specific information about the three multiclass of apples, especially the quality attributes evaluating whether they’re compliant or not, thus enabling the model to distinguish not only the varieties but also the state of the apple.
Categorizing Data
To be more precise, and accurate and make a distinction between healthy fruit and rotten fruit, the following figure has been provided. Categorizing the data is essential for evaluating Apple's quality to enhance immediately the accuracy of the model, refining its ability to compare the model performance with traditional approaches. This data was split into healthy ‘compliant’ and rotten fruit ‘not compliant’ to make that classification easier for the model, without necessarily assigning individual labels to differentiate fruit types, thus allowing for a more nuanced and targeted analysis (apples are identified as fruits without the need for individual labeling). The dataset includes six labels: (Fuji-compliant, Fuji non-compliant, GALA compliant, GALA non-compliant, Golden Delicious compliant, and Golden Delicious non-compliant) as shown in figure 5.
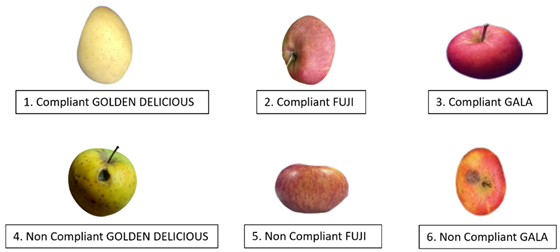
Figure 5. Categorization of Apples Based on Variety and Conformity Levels
Data Augmentation
Data augmentation is the step just before training starts, which is employed to avoid or reduce overfitting,(38) and to classify pictures correctly. Then, data augmentation techniques, such as rotation, flipping, and brightness adjustment, were applied.
The images were resized from their original size to a personalized size of 224×224×3, categorized, and reorganized. Resizing refers to changing the output image size by adjusting its width, height, and RGB channel (Red, Green, and Blue) to increase or decrease pixels.(34) Image brightness can be modified by adjusting each pixel value, which ranges from 0 (black) to 255 (white).(37) The following figure (figure 6) displays the images of compliant GD Apple employing different augmentation approaches to the original pictures.
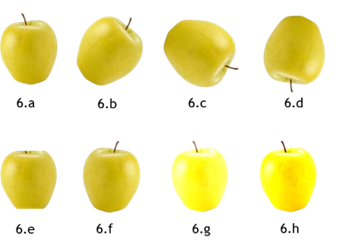
Figure 6. Augmentation Techniques Applied to Healthy Golden Delicious Apples: 6. a. Original 6.b. Rotation 45°. 6.c. Rotation 125° 6.d. Vertical Flip. 6.e. Center Crop 6.f. Horizontal Flip 6.g. 80 % of Brightness 6.h. 80 % of Contrast
The same approach was applied to rotten fruit to increase the data volume, as shown in figure 7.
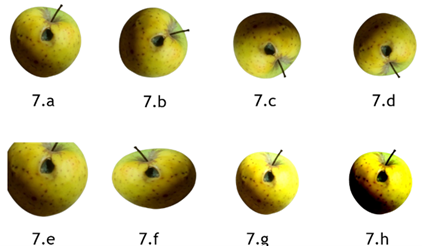
Figure 7. Augmentation Techniques Applied to Rotten Golden Delicious Apples: 7. a. Original 7. b. Rotation 45° 7. c. Rotation 125° 7. d. Vertical Flip 7. e. Center Crop 7.f. Horizontal Flip 7.g. 80 % of Brightness 7.h. 80 % of Contrast
Data Training
Hyper tuning
CNN contains multiple layers that begin with the input layer, especially images, and finish with the output layer passing by hidden layers.(53) The hidden layers contain a fusion of the convolutional layer (crucial layer), pooling layer, and fully connected layers.(54)
Convolution is used to facilitate calculation efficiency without losing data. It is a combination of linear operations which work by capturing data from pictures using Kernel(54) and non-linear operation which is altered to data through activating functions such as RELU, and SoftMax to be used after. Its purpose is to identify characteristics from raw data, particularly images.(55)
The pooling layer follows the convolutional layer, it simplifies images large size to a small size (pixels) minimizes the overfitting, and trains many times faster.(56) Then, the feature is changed to a 1D vector (flattened), and it becomes a fully connected layer for processing and classification; that means all neurons are connected and then, it joins the dense layer which has a classifier that uses activation functions cited before. The RELU function is commonly used in CNNs:
![]()
SoftMax is a function that converts a vector of positive values to probability distributions, ranging between 0 and 1, representing possible outcomes. Represents the i-th element of the input vector, also m means overall classes.

Equation (2) helps users identify the maximum probability generated by the system, which must be close to 1 to recognize the type of apple. In our case, we use a specific threshold size to detect the highest probability rate and determine the correct brand. This information is presented in the table below.
|
Table 1. Input Classes for Multi-Class Apple Quality Classification Model |
|
|
Classes |
Designations |
|
0 |
Fuji non-compliant |
|
1 |
Fuji compliant |
|
2 |
GALA non-compliant |
|
3 |
GALA compliant |
|
4 |
Golden Delicious non-compliant |
|
5 |
Golden Delicious compliant |
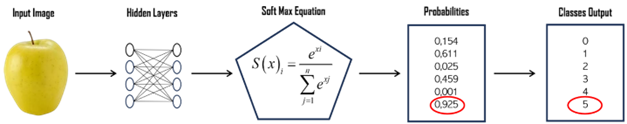
Figure 8. Illustration of Apple Quality Recognition with Maximum Model Accuracy
Based on table 1 and figure 8, and after normalizing the raw data and returning the probabilities that the model trained on, we can see that the proposed image recognition method was successfully identified with the highest probability detected. In other words, after classifying apple quality from image database, the next step impacts switching all images into digital data, that symbolizes the pixels comprising the image. Then, ML algorithms examine this data, through the apples' visual characteristics, such as color, shape, and texture.
The algorithm leverages multiclassification models to assign probabilities to each image, indicating the probability of associating with a specific quality category.
In the meantime, each type of apple may have related probabilities with other types. This means that even the main apple is Golden Delicious apple, but it could also be classified as a Fuji or Gala, with varying probabilities. By time, it is important to indicate that this progressive version is efficient, but it could make mistakes.
Thanks to the probabilistic nature, the class with the highest probability might be assigned to the apple's characteristics, supplying a reliable classification in maximum cases.
Based on the image example, the detected brand of Apple to be chosen by the model will be the one that has the highest probability. Hence, the highest probability match is with class 5, identified as GD comfort, especially with the use of the SoftMax equation(45) and some properties to recognize the right brand after multiple training sessions. This iteration will be done automatically with all the brands of multiclass fruits added by the user. The more the value approaches 1, the more the classification of the model is better.(29)
Several techniques and methods are explained to minimize overfitting
· Data augmentation: it involves randomly increasing the amount through techniques such as rotation, flipping, and cropping, as shown in figures 6 and 7. We changed the position of the original picture of each brand of Apple for both conformities (6 outputs) seven times in random ways.
· Adaptive learning rate is a hyperparameter used to adjust the learning rate (LR) within the training phase. We chose LR=0,001 (10-3) in our study and it helps in faster convergence.(46)
· Dropout: it is tested to any layer in the model to deactivate neurons moreover try to stop the working ones randomly, block or ignore the link between them to stop, or limit the overfitting during the training part.(22) We chose in our case a dropout rate of 20 %.(47)
· Early stopping: is an iterative parameter used principally for regularization to stay away from overfitting and improve the performance of this technique.
Testing
The data were collected from apples grown randomly on one farm to ensure acceptance of local conditions and variations. The dataset comprises high-resolution pictures of apples captured at various ripeness levels, colors, and sizes.
Each image is tagged with information on the apple’s conformity, such as “compliant” or “non-compliant”, and sub-notations for specific defects. The images are distributed among various types of non-conformity including black spots, deformations, and holes, and are presented in figure 5, which enables the model to identify the non-conformity zones.
Before training, the images were normalized in size, resolution, and quality. Additionally, efforts were made to enhance image quality and balance categories to prevent deviations from the optimal model. The dataset was split into one section for training and the other for testing.(47) 2100 pictures are randomly split into an 80/20 ratio due to the small size of the image set. The training set comprises 80 % of the dataset, while the remaining 20 % is appropriate to the testing set.
The training datasets hold approximately 1680 random images of rotten and healthy apples from the three varieties mentioned above, while the training datasets test around 420 random images.
Training of the model is done using 80 % of the dataset and 20 % of images were kept hidden by the model to check its accuracy. Initial experimentation with the Tiny VGG model for multiclassification of three apple varieties, designated Fuji, GALA, and GD respectively, initially produced a success rate of 65 %.
However, following in-depth analysis and additional training, the success rate improved significantly to 80 %. Even this improvement, a specialized platform for configuring and optimizing parameters to suit the task recommended the use of the EfficientNet model.
The adoption of the parameters listed in table 2 led to a significant improvement in classification accuracy, reaching almost 97 % which demonstrates the benefits of the use of EfficientNet. This efficient structure allows to correct representation of complicated data characteristics, resulting in advanced performance in terms of accuracy. EfficientNet outperforms Tiny VGG due to its boosted ability to exploit available data, including small datasets.
Additionally, EfficientNet trains more efficiently, making optimal use of resources, resulting in outstanding performance even in data-limited conditions. The principal purpose for adopting this kind of architecture includes several advantages such as its strength, and impressive accuracy considering this variable as an evaluation degree of closeness in real time between the right value and predicted results, and robust speed performing.
By default, progressing from 65 % to 80 % to 97 % is a remarkable achievement in supervised learning, particularly as the model is advancing towards improvement and robustness. The (CNN) architectures elaborated by Google in 2019(52) are effective, efficient, robust, and require minimal memory.
This network resembles the same elements of MobileNetV2 using SE optimizer (Squeeze and Excitation), which is a recalibration of features to highlight only important information and remove less important ones. The Mobile Inverted Bottleneck (MBC) is a structure designed to minimize costs, and improve the efficiency of architectures, often used in image processing. We can say that it is a combination of the MobileNet V2 architecture with its inverted bottleneck blocks developed uniquely and specifically for deep learning on mobile devices to avoid performance degradation.(57) EfficientNet is selected because it enables users to balance efficiency and precision.(10) Figure 9 shows the basic model based on the EfficientNet Architecture adapted to our Apple quality assessment. Table 2 displays the training parameters configuration for this case study:
|
Table 2. Configuration of Hyperparameters for EfficientNet Architecture |
|
|
Parameters |
Main Value |
|
Image Size |
224×224 |
|
Optimization function |
Adam (Adaptative Moment Estimation)(58) |
|
Epochs |
20 |
|
Batch Size |
32 |
|
Learning Rate |
10-3 |
|
Dropout |
20 % (0,2) |
|
Activation functions in the middle layers |
RELU & convolutional |
|
Activation functions in the final layer |
SoftMax and flattened |
|
Output Classes |
6 classes: Fuji compliant Fuji non-compliant Gala compliant Gala non-compliant Golden Delicious compliant Golden Delicious non-compliant |
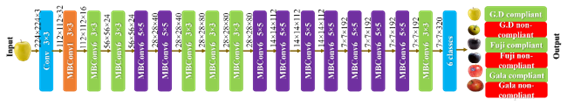
Figure 9. The architecture of EfficientNet
Experimental setup
Selected Model
Many models were tested, including Tiny VGG, MobileNetV2, and other popular architectures, as shown in figure 10. Although Tiny VGG architecture achieved an accuracy rate of 80 %, we improved our experiments through TensorBoard to optimize our results, particularly by adjusting the number of epochs. This pointed out the fact that when trained with appropriate hyperparameters, the EfficientNet architecture significantly outperformed Tiny VGG, reaching an accuracy of 96,88 %. Based on previous experiments and the existing literature(42,43,44,45) EfficientNet excels in accuracy and training speed, making it optimal for our application.
In figure 10.a, the loss curves over the epochs show a rapid convergence for EfficientNet, particularly 20 epochs, where the test data loss significantly decreases (0,1168 for 20 epochs compared to 0,3182 for 5 epochs), illustrating the efficiency of training over the number of epochs. While figure 10.b shows the accuracy curves for the same configurations. EfficientNet reached 96,88 % as accuracy over 20 epochs, surpassing the results achieved although with only 5 epochs. This demonstrates that the EfficientNet architecture is robust and had a positive impact of longer training for complex tasks.
TensorBoard, developed by TensorFlow, plays a vital role in controlling and evaluating the training processes. It allows tracking the loss, accuracy, and precision, while making the tuning of hyperparameters easy and detecting potential issues like overfitting. TensorBoard provides users an overview of the training and validation curves, allowing an insightful comparison between different epochs to identify the highest model performance.
In our study, TensorBoard helped us to visualize the evolution of losses and accuracies across several architectures, revealing that increasing the number of epochs for EfficientNet allowed us to achieve a remarkable accuracy of 96,88 %, a notable improvement compared to other models like Tiny VGG.
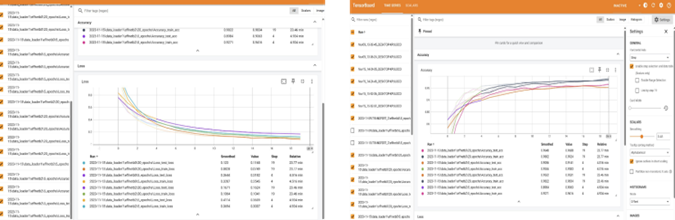
Figure 10.a. Training and Testing Loss Curves b. Training and Testing Accuracy Curves
Figure SEQ figure \* ARABIC 10.TensorBoard Performance for EfficientNet Model.
Evaluation Metrics
The performance measures are metrics that evaluate the quality of a classification model in machine learning and statistics, such as precision, recall, F1-score, accuracy, and the error matrix. It evaluates the predictions made by our classifier, over the class labels to identify both the model's capabilities and weaknesses. And to better figure out how well our model processes the data its given and to enhance its performance overall is crucial to evaluate these performance indicators.
Tuning hyperparameters along with assessing these metrics is vital for boosting the model’s effectiveness since it directly influences how the model optimizes these evaluation measures. To assess our model’s performance, we use the confusion matrix, applying binary classification metrics to categorize data as compliant or non-compliant based on specific features.(59)
Accuracy
The accuracy is a statistical measure that calculates the proportion of correct predictions made by the current model using the primary confusion matrix shown in figure 12. This measure is calculated by the following formula:
![]()
Figure 11 displays six apple samples from three varieties: Golden Delicious, Fuji, and Gala, with predictions indicating whether each apple is compliant or non-compliant. For each sample, the model's prediction is accompanied by a probability score reflecting the confidence in the classification.
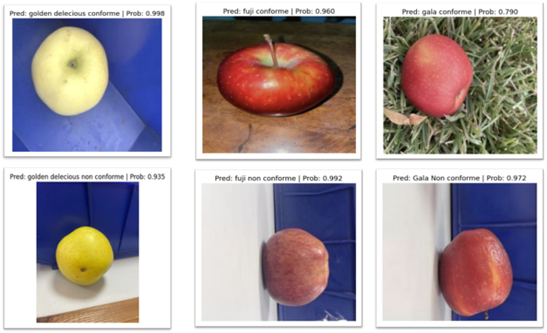
Figure 11. Accuracy Analysis for Apple Classification across Six Categories
Confusion Matrix
A confusion matrix, or the error matrix, is a particular table format that allows visualization of the performance of a supervised learning classification, with two dimensions (actual and predicted). F1-score, specificity, precision, and recall, are four indicators commonly applied in the image processing field to measure the rate of rightness of the probability for all classes. In our model, the confusion matrix of the model which predicts conformity is as follows.
The abbreviated terms in the matrix illustrated in figure 12 are as follows:
· (TP): the model predicts exactly an apple as compliant when it is compliant.
· (FP): the model wrongly predicts an apple as compliant when incompliant.
· (TN): the model predicts exactly an apple as incompliant when it is incompliant.
· (FN): the model wrongly predicts an apple as incompliant when it is compliant.
The life cycle of each model in the artificial intelligence and machine learning process depends primarily on the four fundamental performance indicators as follows:
1. Precision (P): represents correct positive predictions over only positive ones.
![]()
2. Recall (R): means correct positive predictions by whole true positive and false negative. It’s called sensitivity (S).
![]()
3. Specificity (S’): is a vital sign used in the context of multiclassification systems that measures the effectiveness of a test to correctly identify items that don’t possess a particular characteristic.
![]()
4. F1-Score (F1): is a relevant and harmonic indicator that is usually used to measure accuracy: in a binary way (positive/negative).(48,49) This parameter gives the balance between the recall (sensitivity) and the precision as calculated by formula 7.
![]()
The greater the value of the metrics, the more effective the model is. High precision indicates that our model makes fewer mistakes, especially false positive errors. In the same context, high recall suggests that the model captures only the truest positive cases, and a high F1- score demonstrates an optimal balance between precision and recall.(60)
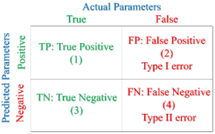
Figure 12. Confusion Matrix: Actual and Predicted Apple Quality
Loss Function
The following function called loss function can be defined as an important element for making a machine learning model training, measuring the interval between the generated predictions by the model and the real observed predictions.
It represents a pivotal role in furnishing an adequate and precise measure of the model's performance and quality. While the loss function is effeciently optimized, the model adjusts its parameters effictively, enhancing overall performance and minimizing errors.
This latter is a powerful tool that is widely used to guide models towards optimal solutions, maximizing prediction accuracy as well as ensuring better adaptation to the data related to Machine Learning.(61)
Each loss function has its specific mathematical formulation and properties. In machine learning and especially in our case study, the cross-entropy loss function is selected considering its common use in classification tasks.(62)
A lower cross-entropy value indicates a better model’s performance, as it reflects improved alignment between the predicted probability distributions and the actual target distributions, leading to more accurate and confident prediction. In other words, a value closer to 0 indicates a well-performing model, while a value approaching 1 suggests poor performance.(63,64,65)
In our case, for a classification problem using CNN with three classes of apples with two conformity levels (conforme, non-conforme): FUJI non-conforme, FUJI conforme, GALA non-conforme, GALA conforme, GD non-conforme, and GD conforme. The cross-entropy loss (L) formula is generalized as:
![]()
Where:
C: is the number of classes: 6 in our case.
Yi: this is the real class indicator. It is equal to 1 if the class i is real. Otherwise, it is 0.
Pi: is the predicted probability by the model for each class.

Figure 13. Training
and Validation Curves over 20 epochs a. Loss
curves during model training b. Accuracy
curves during model training
RESULTS AND DISCUSSION
In this section, we present our results based on the chosen configuration and hyperparameters. The two most important factors when evaluating a machine learning model's performance are accuracy and loss.
The first evaluates how accurately the model predicts the actual values. A greater value indicates better model performance and can be expressed as a percentage.(66) The second, the loss function, measures the error between the model's predictions and the true values and minimizes this loss value.
The training and validation loss curves initially decrease, indicating that the model is acquiring new abilities, learning, and improving.
To avoid overfitting, using the function of early stopping is a common technique. This technique monitors the validation performance and stops the training process when the validation loss stops improving, hence preventing the model from overfitting the training data.(66)
The two plots shown in figure 13 illustrate the performance of our machine-learning model over 20 epochs. The plot shown in figure 13.a indicates the loss curves, with the training loss (the blue curve) decreasing regularly from a value approaching 1,8 to less than 0,6, which indicates an effective and great model learning in our case.
Moreover, the validation loss (orange curve) also decreases, which corroborates the performance of our model.
The plot illustrated in figure 13.b shows the accuracy curves, where the training accuracy (blue curve) consistently rises from nearly 0,3 to above 0,8, demonstrating that the model is improving its ability to correctly predict more instances from the data training by the epochs. Moreover, the validation accuracy (orange curve) follows a steady rise, which is a strong indicator of the model’s accuracy.
As the validation loss increases, the training loss carry on decreasing, it indicates that the model is suffering from overfitting.(67)
Similarly, a large gap between training and validation accuracy would be another sign of overfitting. In this scenario, despite minor fluctuations, the model exhibits controlled overfitting.
Both graphs indicate a progressive reduction in training loss, which suggests effective model learning. The test loss has an identical pattern with noticeable fluctuations, indicating reasonable generalization with some variability.
Both curves were established after about 15 epochs, indicating slight performance improvements. Both the training and test sets reflect a consistent improvement in accuracy, which ended at around 80 %.
On the other hand, the test accuracy demonstrates more variance, indicating possible challenges with generalization and some overfitting. The model shows regular learning throughout the epochs, with the training loss curve showing greater consistency than the test loss trend. There is a significant delay in the test loss, which indicates the model has stabilized at a point after 15 epochs of training.
The model has achieved an optimal accuracy rate of 96,88 % after extensive and iterative training. This high-performance accuracy results from the repetitive process of purifying the model's parameters through repeated exposure to training data. The efficient hyper-tuning makes the model able to learn and generalize traits effectively, thus leading to this important accuracy.
Recalls for each class of our fruit multiclassification model are shown in figure 14, corresponding to three brands and two states of compliance (compliant or non-compliant). The recalls for classes GALA non-compliant and GD non-compliant are particularly high, reaching 1,0 and 0,95 respectively.
This indicates that the model almost perfectly identifies fruits with good and bad compliance, surpassing other classes significantly.
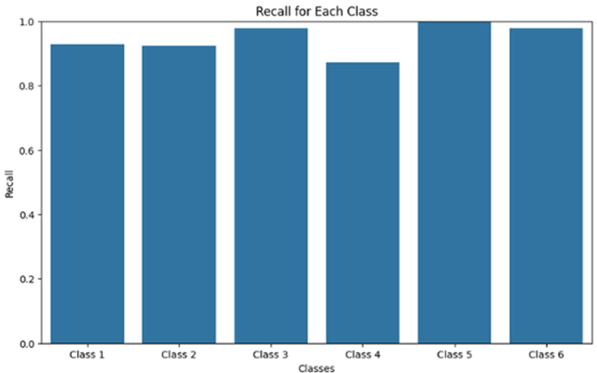
Figure 14. Recall Metrics across Six Classes of Apple Quality
Table 3 displays the accuracy, precision, recall, and F1-score of the suggested model for the Apple multiclassification. Using performance indicators like accuracy (96,88 %), recall (100 %), F1-score (88,88 %), and precision (80 %), it summarizes the model's performance. The model handled false positives quite well, as demonstrated by the fact that 80 % of the predicted positive cases were correct, despite accuracy being partially lower than recall.
Since the model gets an entire recall rate (100 %), it means that the model acquired the possibility to recognize and identify the whole pertinent occurrences, guaranteeing comprehensive coverage of the variety. Based on the following table, there is clear that F1-score and accuracy rate represent two among essentials features that balance predictive performance which reflects our model's effectiveness. 96,88 % accuracy confirms the capability of our model to correctly classify distinct samples. These results confirm the model's effectiveness in multiclassification tasks with optimal performance metrics.
|
Table 3. Summary of Performance Metrics for Apple Quality Multiclassification Model |
||||
|
Evaluation Metrics |
Accuracy (%) |
F1-Score (%) |
Precision (%) |
Recall (%) |
|
Values* |
96,88* |
88,88* |
80* |
100* |
|
*Our research team computed these metric values, including a recall rate of 100 %, using a Python-based implementation for model training and evaluation. |
||||
The following figure shows the interpretation of the model performance via the confusion matrix. Based on the latter, the highest and lowest values are 0,99 and 0,79 respectively. This shows that our multi-classification model performs very sufficiently for most varieties, particularly classes Fuji non-compliant (class 0), GALA non-compliant (class 2), both Golden Delicious non-compliant and compliant (classes 4 and 5), with correct classification rates of up to 99 %. While FUJI compliant and GALA-compliant (classes 1 and 3) demonstrated the lowest values 0,94 and 0,79 respectively. In general, the model classification overall accuracy is 96,88 %. This shows an effective ability to distinguish data belonging to these classes, demonstrating the robustness of the model for these specific varieties.
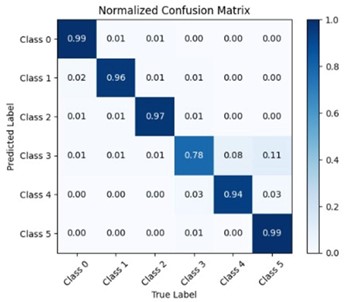
Figure 15. Performance Evaluation of Model Predictions Using a Confusion Matrix
The curve shown in figure 16 represents the training and validation sets' root-mean-square error (RMSE). We see that the loss continuously goes on decreasing smoothly with the epochs. A loss decrease in this manner signifies that the model is constantly fitting the data better and the predictions get closer to the true labels. Scientifically, this smooth descent would converge at a point for which the error is minimal, meaning that the optimization has been achieved.
At the 20th epoch, the loss reaches around 0,10, indicating a good fit of the model to the training data. However, such a low loss may suggest overfitting, reducing its ability to generalize over new images as data. Other additional adjustments may be needed to improve the classification of unseen fruit varieties.
Although RMSE is generally used for regression tasks, in our case of classification it represents an indirect measure of the error in predicting the probabilities of different classes (for example GALA good or not, GD good or not, and FUJI good or not).
Once we see a minimum value of RMSE, it directly means that the model predictions are almost the same as the true classes of our model. For us, it was clear to observe that the curve in blue, that of the training set, is usually lower than that in yellow: of the validation set. This gap is expected since the model tends to match better with training data than validation ones.
The training curve shows a continuous and relatively steady decline of the RMSE, reaching a value of around 0,39 after the 15th epoch (at which point model performance stops improving). This suggests that the training data has reached an optimal point. The validation curve shows a constant decrease in validation error with some oscillations. The decreasing validation RMSE indicates that the current model is adapted to the desired outputs.
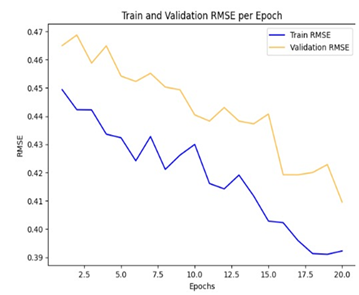
Figure 16. RMSE Evolution During Model Training
Real-world deployment
To validate and improve the model's performance, a case study was done, as shown in figure 17. At this phase, we are currently engaged in the process of organizing a live demonstration to exhibit the system’s functionality in real-time, to evaluate the ability of our computer vision model, and to determine the conformity of a randomly selected apple from the field based entirely on its image.
In the current example, the model correctly identified the apple as a Golden Delicious, demonstrating the accuracy of its classification. Nevertheless, it reached a 95 % probability that the apple was not compliant, referring to quality standards set by experts, and only a 5 % possibility that it was compliant. Although the model is still being trained, it is already capable of distinguishing apple varieties.
The high probability of non-compliance could be explained by visible defects on the apple, such as imperfections or black spots on the skin, which the model has learned to recognize as rejection factors. To summarize, it seems that the model is already capable of distinguishing different varieties of apples, however, it will need to be improved to become more accurate.
The prediction time is particularly short, with a displayed estimate of 0,08255s, demonstrating the speed of the model in image processing. This interface integrates a large image data set, including various apple varieties in different levels of conformity, providing practical references for the model. The interface showcases clear outputs of the model presenting the different percentages of each class.
In conclusion, the deployment of the current model shows promising results, both in terms of performance curves and performance metrics. Key indicators such as accuracy, speed, and efficiency meet user expectations, demonstrating that the system is on track to achieve its goals. The performance curves show a constant improvement, and the collected indicators confirm that the adjustments made throughout the process are effective. It is important to maintain this positive result to optimize long-term performance.
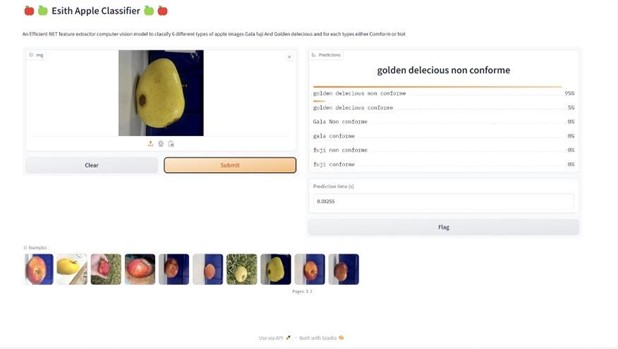
Figure 17. Real-Time Deployment Process of Apple Quality Detection
CONCLUSIONS
This study demonstrates the significant potential of AI and ML in transforming traditional quality control processes in agriculture. Using the EfficientNet architecture, the proposed model achieved an impressive 96,88 % accuracy in classifying three varieties of apples with two levels of conformity. The instance segmentation approach allowed the model to extract essential features, enabling it to distinguish subtle variations between visually similar fruits. A structured methodology, including comprehensive data augmentation, dataset partitioning (80 % training and 20 % testing), and careful optimization of hyperparameters such as learning rate and batch size, contributed to the model’s robustness.
The integration of this model into smart agricultural practices represents a major innovation. By leveraging AI and image processing, it enhances productivity, minimizes human error, and streamlines decision-making in fruit quality assessment. The live dashboard developed alongside the model facilitates real-world deployment, offering stakeholders real-time insights into fruit quality. This functionality aligns the model with international standards and optimizes supply chain operations, providing significant value to the agricultural industry.
Future work envisions extending the system to classify up to 7500 apple varieties in real-time through the integration of live camera feeds. Incorporating multispectral sensors is expected to further enhance accuracy and adaptability to diverse conditions. This comprehensive platform will provide not only real-time classification but also detailed conformity assessments, contributing to more efficient operations, reduced losses, and preservation of the national agricultural heritage. The broader objective is to expand this technology to other fruit varieties, promoting innovation and efficiency across the agricultural sector.
ACKNOWLEDGMENTS
We want to express our sincere gratitude to MOUZOUN ANASS, ASSAL MOHAMMED, ED-DEHBI WISSAL, OUADGHIRI EL MEHDI, and RACHID WARDA for their invaluable contributions to this research paper. We also thank all the people who assisted us in this work, either closely or remotely.
BIBLIOGRAPHIC REFERENCES
1. cycles T text provides general information S assumes no liability for the information given being complete or correct D to varying update, Text SCDM up to DDTR in the. Statista. [cited 2024 Feb 16]. Topic: Smart agriculture. Available from: https://www.statista.com/topics/4134/smart-agriculture/
2. ICT Initiative of SAARC Agriculture Centre in the SAARC Region | IEEE Conference Publication | IEEE Xplore [Internet]. [cited 2024 Feb 16]. Available from: https://ieeexplore.ieee.org/abstract/document/4625002
3. Phosphates et secteur automobile en tête des ventes nationales à l’export [Internet]. [cited 2024 Feb 16]. Available from: https://fr.hespress.com/326757-phosphates-et-secteur-automobile-plafonnent-en-tete-des-ventes-nationales-a-lexport.html
4. Morocco: Production of apples – Agronomist [Internet]. [cited 2024 Nov 21]. Available from: https://agronomist.pl/artykuly/morocco-production-of-apples
5. Apple production, 1961 to 2021 [Internet]. [cited 2023 Nov 8]. Available from: https://ourworldindata.org/grapher/apple-production?tab=table
6. List of apple cultivars - Wikipedia [Internet]. [cited 2024 Feb 23]. Available from: https://en.wikipedia.org/wiki/List_of_apple_cultivars
7. Le 360 Français [Internet]. [cited 2024 Feb 16]. Festival national des pommes d’Ifrane: Fès-Meknès concentre près de 38 % de la production nationale. Available from: https://fr.le360.ma/economie/festival-national-des-pommes-difrane-fes-meknes-concentre-pres-de-38-de-la-production-nationale-139775/
8. Filière Pommier | Ministère de l’agriculture [Internet]. [cited 2024 Feb 16]. Available from: https://www.agriculture.gov.ma/fr/filieres-regions/pomme-dt
9. Coskun M, Ucar A, Yildirim O, Demir Y. Face recognition based on convolutional neural network. In: 2017 International Conference on Modern Electrical and Energy Systems (MEES) [Internet]. Kremenchuk: IEEE; 2017 [cited 2024 Feb 15]. p. 376–9. Available from: http://ieeexplore.ieee.org/document/8248937/
10. Pramudhita DA, Azzahra F, Arfat IK, Magdalena R, Saidah S. Strawberry Plant Diseases Classification Using CNN Based on MobileNetV3-Large and EfficientNet-B0 Architecture. J Ilm Tek Elektro Komput Dan Inform. 2023;9(3):522–34.
11. Taji K, Ghanimi F. Enhancing Plant Disease Classification through Manual CNN Hyperparameter Tuning. Data Metadata. 2023 Jan 20;2:112.
12. New generation farmers: Rediscovering the peasantry - ScienceDirect [Internet]. [cited 2024 May 14]. Available from: https://www.sciencedirect.com/science/article/abs/pii/S074301671830559X
13. An interval valued Pythagorean fuzzy AHP integrated quality function deployment methodology for hazelnut production in Turkey - ScienceDirect [Internet]. [cited 2024 May 14]. Available from: https://www.sciencedirect.com/science/article/abs/pii/S0957417423012101
14. Si W, Xiong J, Huang Y, Jiang X, Hu D. Quality Assessment of Fruits and Vegetables Based on Spatially Resolved Spectroscopy: A Review. Foods. 2022 Apr 20;11(9):1198.
15. Palumbo M, Attolico G, Capozzi V, Cozzolino R, Corvino A, de Chiara MLV, et al. Emerging Postharvest Technologies to Enhance the Shelf-Life of Fruit and Vegetables: An Overview. Foods. 2022 Jan;11(23):3925.
16. Fruit Maturity - an overview | ScienceDirect Topics [Internet]. [cited 2024 May 19]. Available from: https://www.sciencedirect.com/topics/agricultural-and-biological-sciences/fruit-maturity
17. Phenotypic techniques and applications in fruit trees: a review | Plant Methods | Full Text [Internet]. [cited 2024 May 20]. Available from: https://plantmethods.biomedcentral.com/articles/10.1186/s13007-020-00649-7
18. Mohr BC. The Mohr Digi-Test (MDT) Computerized Agricultural Penetrometer as an Apple Maturity Tool.
19. What is a Brix Refractometer, and how do they work? [Internet]. [cited 2023 Nov 8]. Available from: https://www.instrumentchoice.com.au/news/what-is-a-brix-refractometer-and-how-do-they-work
20. (5) Fruit Classification Using Traditional Machine Learning and Deep Learning Approach | Request PDF [Internet]. [cited 2024 Mar 12]. Available from: https://www.researchgate.net/publication/338414015_Fruit_Classification_Using_Traditional_Machine_Learning_and_Deep_Learning_Approach
21. Rizzo M, Marcuzzo M, Zangari A, Gasparetto A, Albarelli A. Fruit ripeness classification: A survey. Artif Intell Agric. 2023 Mar 1;7:44–57.
22. Important Considerations When Choosing Your Supplier of Wholesale Fruits and Vegetables - Fruitique Wholesale [Internet]. 2019 [cited 2024 May 20]. Available from: https://fruitiquewholesale.com.au/important-considerations-when-choosing-your-supplier-of-wholesale-fruits-and-vegetables/
23. Lai JW, Ramli HR, Ismail LI, Wan Hasan WZ. Oil Palm Fresh Fruit Bunch Ripeness Detection Methods: A Systematic Review. Agriculture. 2023 Jan;13(1):156.
24. da Silveira F, Lermen FH, Amaral FG. An overview of agriculture 4.0 development: Systematic review of descriptions, technologies, barriers, advantages, and disadvantages. Comput Electron Agric. 2021 Oct 1;189:106405.
25. Abbasi R, Martinez P, Ahmad R. The digitization of agricultural industry – a systematic literature review on agriculture 4.0. Smart Agric Technol. 2022 Dec;2:100042.
26. Hassan SI, Alam MM, Illahi U, Al Ghamdi MA, Almotiri SH, Su’ud MM. A Systematic Review on Monitoring and Advanced Control Strategies in Smart Agriculture. IEEE Access. 2021;9:32517–48.
27. Sustainability | Free Full-Text | Fruit Image Classification Model Based on MobileNetV2 with Deep Transfer Learning Technique [Internet]. [cited 2024 May 19]. Available from: https://www.mdpi.com/2071-1050/15/3/1906
28. K B M, R R. Classification of Fruits using Deep Learning Algorithms. 2022.
29. Towards making the fields talks: A real-time cloud enabled IoT crop management platform for smart agriculture - PMC [Internet]. [cited 2024 May 20]. Available from: https://www.ncbi.nlm.nih.gov/pmc/articles/PMC9846789/
30. A Bibliometric Network Analysis of Recent Publications on Digital Agriculture to Depict Strategic Themes and Evolution Structure - PMC [Internet]. [cited 2024 May 20]. Available from: https://www.ncbi.nlm.nih.gov/pmc/articles/PMC8659853/
31. Monteiro A, Santos S, Gonçalves P. Precision Agriculture for Crop and Livestock Farming—Brief Review. Animals. 2021 Aug 9;11:2345.
32. Wolfert S, Ge L, Verdouw C, Bogaardt MJ. Big Data in Smart Farming – A review. Agric Syst. 2017 May 1;153:69–80.
33. Washington P, Park N, Srivastava P, Voss C, Kline A, Varma M, et al. Data-Driven Diagnostics and the Potential of Mobile Artificial Intelligence for Digital Therapeutic Phenotyping in Computational Psychiatry. Biol Psychiatry Cogn Neurosci Neuroimaging. 2020 Aug 1;5(8):759–69.
34. Blasco J, Aleixos N, Moltó E. Machine Vision System for Automatic Quality Grading of Fruit. Biosyst Eng. 2003 Aug 1;85(4):415–23.
35. Sri VS, Sailu VH, Pradeepthi U, Sai PM, Kavitha M. Disease Detection using Region-Based Convolutional Neural Network and ResNet. Data Metadata. 2023 Jan 20;2:135.
36. Zhang R, Sarmientor J, Ocampo ALD, Hernandez R. Fruit and vegetable self-billing system based on image recognition. Data Metadata. 2024 Jan 1;3:.397.
37. (PDF) Implementation of artificial intelligence in agriculture for optimisation of irrigation and application of pesticides and herbicides [Internet]. [cited 2024 Mar 13]. Available from: https://www.researchgate.net/publication/340869105_Implementation_of_artificial_intelligence_in_agriculture_for_optimisation_of_irrigation_and_application_of_pesticides_and_herbicides
38. (8) (PDF) Machine Vision based Fruit Classification and Grading - A Review [Internet]. [cited 2024 Apr 8]. Available from: https://www.researchgate.net/publication/318486455_Machine_Vision_based_Fruit_Classification_and_Grading_-_A_Review
39. Bhargava A, Bansal A. Fruits and vegetables quality evaluation using computer vision: A review. J King Saud Univ - Comput Inf Sci. 2021 Mar 1;33(3):243–57.
40. kavdır I, Guyer DE. Apple grading using fuzzy logic. Turk J Agric For. 2003 Jan 1;27:375–82.
41. Mulyani EDS, Susanto JP. Classification of maturity level of fuji apple fruit with fuzzy logic method. In: 2017 5th International Conference on Cyber and IT Service Management (CITSM) [Internet]. Denpasar, Bali, Indonesia: IEEE; 2017 [cited 2023 Oct 18]. p. 1–4. Available from: http://ieeexplore.ieee.org/document/8089294/
42. Automated fruit recognition using EfficientNet and MixNet - ScienceDirect [Internet]. [cited 2024 Feb 17]. Available from: https://www.sciencedirect.com/science/article/abs/pii/S0168169919319787
43. Srinidhi VV, Sahay A, Deeba K. Plant Pathology Disease Detection in Apple Leaves Using Deep Convolutional Neural Networks : Apple Leaves Disease Detection using EfficientNet and DenseNet. In: 2021 5th International Conference on Computing Methodologies and Communication (ICCMC) [Internet]. Erode, India: IEEE; 2021 [cited 2023 Nov 13]. p. 1119–27. Available from: https://ieeexplore.ieee.org/document/9418268/
44. Albarrak K, Gulzar Y, Hamid Y, Mehmood A, Soomro AB. A Deep Learning-Based Model for Date Fruit Classification. Sustainability. 2022 May 23;14(10):6339.
45. Apple quality identification and classification by image processing based on convolutional neural networks | Scientific Reports [Internet]. [cited 2024 Apr 10]. Available from: https://www.nature.com/articles/s41598-021-96103-2
46. Wang J jing, Zhao D an, Ji W, Tu J jun, Zhang Y. Application of support vector machine to apple recognition using in apple harvesting robot. In: 2009 International Conference on Information and Automation [Internet]. 2009 [cited 2024 Mar 13]. p. 1110–5. Available from: https://ieeexplore.ieee.org/document/5205083
47. Zhou H, Wang Y, Lei X, Liu Y. A Method of Improved CNN Traffic Classification. In: 2017 13th International Conference on Computational Intelligence and Security (CIS) [Internet]. 2017 [cited 2024 Apr 8]. p. 177–81. Available from: https://ieeexplore.ieee.org/abstract/document/8288468
48. Agriculture | Free Full-Text | Apple Varieties Classification Using Deep Features and Machine Learning [Internet]. [cited 2024 Mar 13]. Available from: https://www.mdpi.com/2077-0472/14/2/252
49. Xu B, Cui X, Ji W, Yuan H, Wang J. Apple Grading Method Design and Implementation for Automatic Grader Based on Improved YOLOv5. Agriculture. 2023 Jan;13(1):124.
50. Morshed MS, Ahmed S, Ahmed T, Islam MU, Rahman ABMA. Fruit Quality Assessment with Densely Connected Convolutional Neural Network [Internet]. arXiv; 2022 [cited 2024 Mar 13]. Available from: http://arxiv.org/abs/2212.04255
51. Adige S, Kurban R, Durmuş A, Karaköse E. Classification of apple images using support vector machines and deep residual networks. Neural Comput Appl. 2023 Jun 1;35(16):12073–87.
52. Shape-based Fruit Recognition and Classification | SpringerLink [Internet]. [cited 2024 Mar 13]. Available from: https://link.springer.com/chapter/10.1007/978-981-10-6430-2_15
53. Liu YH. Feature Extraction and Image Recognition with Convolutional Neural Networks. J Phys Conf Ser. 2018 Sep;1087(6):062032.
54. Alzubaidi L, Zhang J, Humaidi AJ, Al-Dujaili A, Duan Y, Al-Shamma O, et al. Review of deep learning: concepts, CNN architectures, challenges, applications, future directions. J Big Data. 2021 Mar 31;8(1):53.
55. Raju A, Thirunavukkarasu S, Raju A, Thirunavukkarasu S. Convolutional Neural Network Demystified for a Comprehensive Learning with Industrial Application. In: Dynamic Data Assimilation - Beating the Uncertainties [Internet]. IntechOpen; 2020 [cited 2023 Nov 23]. Available from: https://www.intechopen.com/chapters/72480
56. Sangeetha R, Rani MMS. Tomato leaf disease prediction using convolutional neural network. Int J Innov Technol Explor Eng. 2019;9(1):1348–52.
57. Pröve PL. Medium. 2018 [cited 2023 Dec 8]. MobileNetV2: Inverted Residuals and Linear Bottlenecks. Available from: https://towardsdatascience.com/mobilenetv2-inverted-residuals-and-linear-bottlenecks-8a4362f4ffd5
58. Islam MT, Karim Siddique BMN, Rahman S, Jabid T. Food Image Classification with Convolutional Neural Network. In: 2018 International Conference on Intelligent Informatics and Biomedical Sciences (ICIIBMS) [Internet]. 2018 [cited 2024 Jan 7]. p. 257–62. Available from: https://ieeexplore.ieee.org/document/8550005
59. Enhanced Skin Condition Prediction Through Machine Learning Using Dynamic Training and Testing Augmentation | IEEE Journals & Magazine | IEEE Xplore [Internet]. [cited 2023 Dec 19]. Available from: https://ieeexplore.ieee.org/document/9007729
60. Powers DMW. Evaluation: from precision, recall and F-measure to ROC, informedness, markedness and correlation [Internet]. arXiv; 2020 [cited 2024 Jul 2]. Available from: http://arxiv.org/abs/2010.16061
61. Huang J, Chen B, Yao B, He W. ECG Arrhythmia Classification Using STFT-Based Spectrogram and Convolutional Neural Network. IEEE Access. 2019;7:92871–80.
62. Andreieva V, Shvai N. Generalization of cross-entropy loss function for image classification. [cited 2024 Oct 16]; Available from: https://ekmair.ukma.edu.ua/items/b4a5dc04-247b-403f-88cb-4fe23e7e03bb
63. Godoy D. Medium. 2022 [cited 2024 Jun 9]. Understanding binary cross-entropy / log loss: a visual explanation. Available from: https://towardsdatascience.com/understanding-binary-cross-entropy-log-loss-a-visual-explanation-a3ac6025181a
64. Ananth B. Hybrid Support Vector Machine for Predicting Accuracy of Conflict Flows in Software Defined Networks. Salud, Ciencia y Tecnología. 2024. 4:797. https://doi.org/10.56294/saludcyt2024797
65. Wei W, Nazura Bt. AM, Bin Abd Rahman MR. Research on the Issues and Paths of Citizen Privacy Protection in China in the Era of Big Data. Salud, Ciencia y Tecnología. 2024;4:.1208.
66. Interpretation of Loss and Accuracy for a Machine Learning Model | Baeldung on Computer Science [Internet]. 2021 [cited 2024 Jun 25]. Available from: https://www.baeldung.com/cs/ml-loss-accuracy
67. Goodfellow I, Bengio Y, Courville A. Deep Learning. MIT Press; 2016. 801 p.
FINANCING
The authors did not receive financing for the development of this research.
CONFLICT OF INTEREST
None.
AUTHORSHIP CONTRIBUTION
Conceptualization: IYOUBI El Mehdi, EL BOQ Raja, IZIKKI Kenza, TETOUANI Samir, CHERKAOUI Omar, SOULHI Aziz.
Formal analysis: IYOUBI El Mehdi, EL BOQ Raja, IZIKKI Kenza, TETOUANI Samir, CHERKAOUI Omar, SOULHI Aziz.
Research: IYOUBI El Mehdi.
Methodology: IYOUBI El Mehdi, EL BOQ Raja, IZIKKI Kenza, TETOUANI Samir, CHERKAOUI Omar, SOULHI Aziz.
Software: IYOUBI El Mehdi, EL BOQ Raja, IZIKKI Kenza, TETOUANI Samir, CHERKAOUI Omar, SOULHI Aziz.
Supervision: EL BOQ Raja, TETOUANI Samir, CHERKAOUI Omar, SOULHI Aziz.
Validation: CHERKAOUI Omar, SOULHI Aziz.
Drafting - original draft: IYOUBI El Mehdi, EL BOQ Raja, IZIKKI Kenza.
Writing - proofreading and editing: IYOUBI El Mehdi, EL BOQ Raja, IZIKKI Kenza.