doi: 10.56294/dm2024.617
ORIGINAL
Experimental Data-Driven Estimation of Impulse Response in Audio Systems Using Parametric and Non-Parametric Methods
Estimación experimental basada en datos de la respuesta al impulso en sistemas de audio utilizando métodos paramétricos y no paramétricos
Angelo J. Soto-Vergel1
![]() *, Oriana A.
Lopez-Bustamante2
*, Oriana A.
Lopez-Bustamante2 ![]() *, Byron
Medina-Delgado2
*, Byron
Medina-Delgado2 ![]() *
*
1University at Buffalo, Department of Industrial and Systems Engineering. Buffalo, New York, United Sates of América.
2Universidad Francisco de Paula Santander, Department of Electrical and Electronics Engineering. Cúcuta, Colombia.
Cite as: Soto-Vergel AJ, Lopez-Bustamante OA, Medina-Delgado B. Experimental Data-Driven Estimation of Impulse Response in Audio Systems Using Parametric and Non-Parametric Methods. Data and Metadata. 2024; 3:617. https://doi.org/10.56294/dm2024.617
Submitted: 05-06-2024 Revised: 05-09-2024 Accepted: 14-12-2024 Published: 15-12-2024
Editor:
Adrián
Alejandro Vitón Castillo ![]()
Corresponding author: Angelo J. Soto-Vergel *
ABSTRACT
The impulse response is a fundamental tool for characterizing linear time-invariant (LTI) systems, enabling the derivation of a mathematical model that accurately describes system dynamics under arbitrary input conditions. This study used experimental data to estimate the impulse response of an audio system—comprising an amplifier, a speaker, a room, and a microphone. Four methods were employed: two parametric and two non-parametric approaches, applied in both the time and frequency domains. The methods were evaluated quantitatively using the Root Mean Square Error (RMSE) metric and qualitatively through a perceptual analysis with six participants. The parametric frequency-domain method achieved the best perceptual results, with 75 % of participants rating the output as good. While this method exhibited slightly higher RMSE compared to other techniques, its low filter order (8) resulted in superior computational efficiency. The findings highlight that perceptual alignment often diverges from purely mathematical error minimization. Real-time implementation of the selected impulse response further demonstrated its practical application in audio processing systems. This research bridges quantitative metrics and human auditory perception, emphasizing the need for balanced decision-making in audio system modeling. The results contribute to advancing data-driven methodologies in acoustics, offering insights into both experimental design and computational efficiency.
Keywords: Impulse Response; Audio System; Transfer Function; Experimental Data; Signal Processing.
RESUMEN
La respuesta al impulso es una herramienta fundamental para caracterizar sistemas lineales invariantes en el tiempo (LIT), lo que permite la derivación de un modelo matemático que describe con precisión la dinámica del sistema bajo condiciones de entrada arbitrarias. Este estudio utilizó datos experimentales para estimar la respuesta al impulso de un sistema de audio, que comprende un amplificador, un altavoz, una sala y un micrófono. Se emplearon cuatro métodos: dos enfoques paramétricos y dos no paramétricos, aplicados tanto en el dominio del tiempo como en el de la frecuencia. Los métodos se evaluaron cuantitativamente utilizando la métrica Root Mean Square Error (RMSE) y cualitativamente a través de un análisis de percepción con seis participantes. El método paramétrico del dominio de la frecuencia logró los mejores resultados de percepción, con un 75 % de los participantes calificando el resultado como bueno. Si bien este método exhibió un RMSE ligeramente más alto en comparación con otras técnicas, su bajo orden de filtro (8) resultó en una eficiencia computacional superior. Los hallazgos resaltan que la alineación perceptual a menudo diverge de la minimización de errores puramente matemáticos. La implementación en tiempo real de la respuestaal impulso seleccionada demostró aún más su aplicación práctica en sistemas de procesamiento de audio. Esta investigación vincula las métricas cuantitativas con la percepción auditiva humana, y pone de relieve la necesidad de una toma de decisiones equilibrada en el modelado de sistemas de audio. Los resultados contribuyen a impulsar metodologías basadas en datos en acústica, ofreciendo información sobre el diseño experimental y la eficiencia computacional.
Palabras clave: Respuesta al Impulso; Sistema de Audio; Función de Transferencia; Datos Experimentales; Procesamiento de Señales.
INTRODUCTION
Estimating the impulse response of a system using experimental data has been widely applied in various engineering domains. For example, it has been used to characterize DC motors by deriving their transfer functions, either through pulse frequency encoders to measure output velocity(1) or by injecting arbitrary input signals and analyzing the resulting angular velocity data.(2) Impulse responses have also been utilized to derive frequency response functions for systems,(3) determine thermal properties of materials (thermal impulse response),(4) and characterize noise in voice-related applications.(5)
In acoustical engineering, impulse response estimation is vital for sound reinforcement, which involves designing and configuring audio processing and amplification systems to achieve studio-quality sound in live performance venues.(6,7,8) Research in this area has addressed reconstructing sound fields in rooms using comprehensive sensing,(9) accounting for nonlinearities in amplifiers and speakers,(10) and developing algorithms to optimize resonance zones for improved sound perception.(11) Despite the significant theoretical advancements, limited focus has been placed on evaluating these models from the perspective of human auditory perception.
Impulse response measurements of linear systems provide an initial understanding of their dynamics and are typically evaluated using metrics such as signal-to-noise ratio (SNR), frequency response, and real-time processing capabilities, which are tied to computational costs.(12) However, these evaluations are often limited to theoretical-mathematical comparisons, with little emphasis on experimental validation from the perspective of human auditory perception.
To address this gap, this study presents four methods—two parametric and two non-parametric—for estimating the impulse response of an audio system. The results are evaluated quantitatively using the Root Mean Square Error (RMSE) metric and qualitatively through a perceptual survey. This dual evaluation approach aims to support decision-making not only based on standard metrics but also by balancing these with the auditory needs of the human ear to discern sound quality. The objective is to integrate quantitative accuracy with perceptual insights, providing a comprehensive approach to system modeling and decision-making. This research contributes to advancing experimental methodologies, bridging the gap between theoretical models and real-world human-centric applications.
METHOD
The methodology consists of three stages. The first stage involves approximating the impulse response of specific elements within the audio chain depicted in figure 1, which includes an amplifier, a speaker, the sound propagation distortion in a particular room, and a microphone. The second stage evaluates the results both quantitatively and qualitatively to determine the most accurate estimation. Finally, the third stage applies the selected impulse response in real-time to emulate the sound produced when test signals pass through the physical components of the audio chain. figure 2 graphically shows this methodology and details the phases involved in each of the stages.

Figure 1. Sound chain design
To conduct the experiments, a database of four string instruments with 106 audio samples corresponding to musical notes was used, distributed as shown in table 1.
|
Table 1. Audio samples by instrument |
|||
|
Instrument |
Input |
Output |
Test |
|
Acoustic guitar |
15 |
15 |
15 |
|
Electric guitar |
15 |
15 |
15 |
|
Small electric guitar |
15 |
15 |
15 |
|
Ukulele |
8 |
8 |
8 |
It is important to note that, to estimate the impulse response in a generalized manner, it is assumed that the system, h[n], corresponds to an LTI (Linear Time-Invariant) system, allowing the application of the superposition theorem. Consequently, two vectors are created: one for input and one for output, which represents the sum of all the samples in the database.
Impulse Response Estimation
Following the methodology in figure 2, the Impulse Response Estimation stage has the objective to test different FIR (Finite Impulse Response) filter models that emulate the effect produced by the audio chain shown in figure 1.

Figure 2. Research Methodology
To achieve this, two parametric methods are implemented—one in the time domain and another in the frequency domain—as well as a non-parametric method using time-domain data. The parametric estimation of h[n] in the time domain involves representing the system through the matrix form of Equation (1), which reflects the convolution operation y=x*h point by point.

Where:
· xn is the matrix representing the input data in Toeplitz matrix form.
· hn is the matrix of coefficients of the impulse response.
· yn is the matrix of output data from the system.
In this context, it is possible to derive the solution to Equation (1) to determine using Equation (2).
h=X-1∙y (2)
Where: X is the matrix of input data from the system in Toeplitz matrix form.
The parametric estimation of h[n] in the frequency domain is based on determining the filter values using Equation (3), which represents the Fourier transform of the system’s impulse response. Once H(ω) is obtained, the inverse Fourier transform is applied to compute h[n].
H(ω)=(Ytotal (ω))/(Xtotal (ω) ) (3)
Where:
· H(ω) is the frequency-domain matrix representing the system’s impulse response.
· Y_total (ω) is the frequency-domain matrix representing the sum of the output data.
· X_total (ω) is the frequency-domain matrix representing the sum of the input data.
Finally, the non-parametric estimation of h[n] is implemented using MATLAB’s impulseest function. This function determines an impulse response model based on the provided time-domain or frequency-domain data. The model’s order, or the number of non-zero impulse response coefficients, is automatically calculated using the persistence of excitation in the input data.
Impulse Response Selection
This involves two main phases: a quantitative evaluation using the RMSE (Root Mean Square Error) metric as defined in Equation (4), and a qualitative evaluation based on the perception of six participants who listened to the results produced by the methods described in the quantitative phase. The purpose of this dual evaluation is to identify the most suitable estimation for human auditory perception.
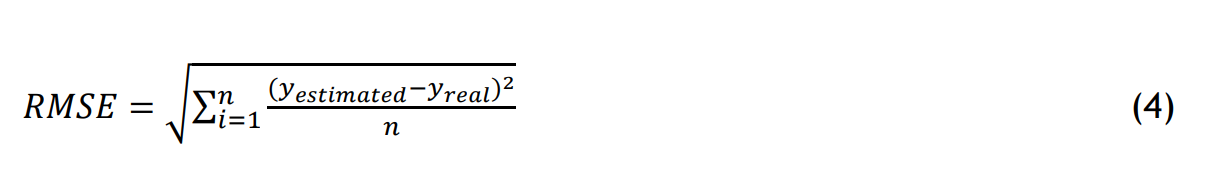
Where:
· yestimated is the sample calculated using the experimentally estimated impulse response.
· yrealis the measured real sample.
· n is the number of samples in the audio sequence.
The perception evaluation was conducted with six participants of varying ages and musical backgrounds, using four specific audio samples from the database, one for each instrument. This perception was categorized into three levels: Good, Regular, and Poor, coded with scores of 3, 2, and 1, respectively. These scores were used to derive a comparable value for each method and relate it to the RMSE, ultimately determining the final filter selection.
Real-Time Testing
This stage involved applying the selected impulse response in real-time. Once the impulse response was determined, a program was developed to apply this function to audio samples in real time. The program captured audio samples from a sound card connected to a computer, with a sampling frequency of 44,100 Hz and a 16-bit resolution. The processed audio was output through the same sound card in the same input format.
The tests used the audio files described in table 1 and compared execution times for different FIR filter implementations, including direct form I, transposed form, and circular buffer implementations. Additional tests included second-order sections in cascade (conventional and floating-point), polyphase implementation (conventional and floating-point), and convolution operations specific to this case.
RESULTS AND DISCUSSION
The results are structured based on the methodology outlined in figure 2, presenting both the qualitative and quantitative analyses of the proposed experiment. The coding was implemented in Python, while MATLAB was used for non-parametric estimation.
Impulse Response Estimation and Perception Evaluation
Figure 3 illustrates the results of testing impulse response estimations in the time domain for filters of varying orders, using the RMSE metric as the evaluation criterion. Three specific filter lengths for h[n] are highlighted—190, 260, and 326—based on which perception tests were conducted. These filter lengths correspond to the selected orders for further analysis.

Figure 3. RMSE vs Order of h[n] for time domain analysis
Table 2 shows the perception test’s results with the three filters estimated in the time domain.
|
Table 2. Perception by each person with estimated in the time domain |
||||||||||||
|
Person |
Test audios |
|||||||||||
|
a1 |
a2 |
a3 |
a4 |
|||||||||
|
h1 [n] |
h2 [n] |
h3 [n] |
h1 [n] |
h2 [n] |
h3 [n] |
h1 [n] |
h2 [n] |
h3 [n] |
h1 [n] |
h2 [n] |
h3 [n] |
|
|
P1 |
M |
R |
B |
R |
R |
M |
R |
R |
B |
M |
R |
B |
|
P2 |
R |
R |
R |
R |
R |
M |
R |
R |
B |
M |
R |
R |
|
P3 |
B |
R |
R |
B |
M |
M |
R |
R |
M |
B |
B |
R |
|
P4 |
M |
B |
B |
R |
M |
M |
M |
M |
M |
B |
R |
R |
|
P5 |
R |
R |
R |
M |
M |
M |
R |
R |
R |
M |
R |
R |
|
P6 |
M |
M |
M |
B |
B |
M |
B |
B |
B |
B |
B |
B |
|
B: Good, R: Average, M: Bad, an: test audio, hn [n]: impulse response with orders 190, 260, and 326 respectively. |
||||||||||||
Figure 4 presents the RMSE metric calculated from the impulse response estimation in the frequency domain, plotted as a function of the filter order. For this case, an expansion of the first 10 filter lengths is shown, demonstrating that for a filter order of 8, the error decreases significantly, making it unnecessary to consider other possible values.
Table 3 summarizes the results of the perception test conducted using the filter estimated in the frequency domain.

Figure 4. RMSE vs Order of h[n] for frequency domain analysis
|
Table 3. Perception by each person with h[n] estimated in Matlab |
||||||||
|
Person |
Time |
Frequency |
||||||
|
a1 |
a2 |
a3 |
a4 |
a1 |
a2 |
a3 |
a4 |
|
|
P1 |
R |
B |
R |
B |
B |
B |
M |
R |
|
P2 |
R |
B |
R |
B |
B |
B |
R |
R |
|
P3 |
B |
B |
B |
B |
B |
B |
B |
R |
|
P4 |
R |
M |
B |
B |
B |
B |
R |
R |
|
P5 |
B |
B |
R |
B |
B |
B |
B |
B |
|
P6 |
M |
R |
B |
B |
R |
B |
R |
B |
|
B: Good, R: Average, M: Bad, an: test audio, hn [n]: impulse response with orders 189, 259, and 325 respectively |
||||||||
Impulse Response Selection
Table 4 presents the qualitative and quantitative results of the tests conducted for the estimation of h[n]. It is important to note that the perception evaluation categories—Good, Regular, and Poor—are scored as 3, 2, and 1, respectively. A total perception score is then calculated for each estimated filter, and these values are displayed in the table.
|
Table 4. Relationship between RMSE, order of h[n] and perception |
|||||
|
Type of estimate |
Parameters |
||||
|
RMSE |
Order of h[n] |
Perception |
|||
|
Parametric |
Time |
h1[n] |
1,09 |
189 |
47 |
|
h2[n] |
1,08 |
259 |
48 |
||
|
h3[n] |
1,07 |
325 |
46 |
||
|
Frequency |
h4[n] |
1,39 |
8 |
66 |
|
|
Non-parametric |
Time |
h5[n] |
1,11 |
69 |
61 |
|
Frequency |
h6[n] |
1,40 |
69 |
62 |
|
Based on the presented data, the impulse response estimated using the parametric method in the frequency domain was selected due to its higher perception score and lower computational cost, as its filter order was significantly lower than the other tested filters. The final h[n] is of order 8 and is as follows:
h[n]= [0,2154; 0,0107; 0,1879; 0,1734; 0,000716; 0,20106; 0,18921; 0,0651; 0,1269]
Real-Time Implementation and Algorithmic Description
The sounddevice library was used to create a function that applies the selected impulse response coefficients through a convolution operation with the input data. The program was implemented as a console-based menu, allowing users to select and apply the impulse response effect to the input. The output audio files were compared with the real-time implementation results for the respective inputs, recalculating the described metrics. Tests were also conducted using voice as input through the computer’s microphone. The flowchart in Figure 5 outlines the algorithmic implementation for this study.

Figure 5. Software architecture for impulse response estimation
Finally, table 5 presents the execution times for the different implementations of as an FIR filter, including the convolution operation.
|
Table 5. Execution times of h[n] for different implementations |
||
|
Implementation type |
Run time (ms) |
|
|
Direct Form I FIR |
Conventional |
0,015 |
|
Transpose |
0,012 |
|
|
With circular buffer |
0,017 |
|
|
Using floating point |
0,016 |
|
|
Cascade FIR |
Conventional |
0,025 |
|
Using floating point |
0,027 |
|
|
Polyphase FIR |
Conventional |
0,008 |
|
Using floating point |
0,007 |
|
|
Convolution |
1D Convolution |
16,201 |
CONCLUSIONS
This study implemented four methods for estimating the impulse response of an audio system using experimental data: two parametric and two non-parametric approaches, applied in both the time and frequency domains. Additionally, perception evaluations were conducted with six participants to analyze the error induced by the estimated transfer function from a human auditory perspective. The workflow was summarized in a flowchart to ensure reproducibility.
The most appropriate estimation method was the parametric approach in the frequency domain, as it achieved the best results in both RMSE and perception evaluations. Moreover, its significantly lower filter order compared to other methods made it computationally more efficient.
The perception evaluations revealed notable variations in participant opinions, particularly between two distinct groups. Participants with musical skills (e.g., playing instruments such as guitar or drums) preferred results that effectively reduced background noise in the original recordings. This highlights the influence of individual auditory training on qualitative assessments. Future work should include testing with non-musical recordings to further explore this variability.
Despite the parametric frequency-domain method having an error rate approximately 30 % higher than other methods, it outperformed the highest-order time-domain parametric method by 43,5 % in the qualitative evaluation. This demonstrates that methods achieving minimal error do not necessarily align with what the human ear perceives as optimal.
In real-time testing, the execution of h[n] proved critical. Various FIR filter implementations and convolution operations were tested, with the polyphase implementation emerging as the most suitable due to its computational speed.
REFERENCES
1. López-Mendoza D, Connolly D, Romero A, Kouroussis G, Galvín P. A transfer function method to predict building vibration and its application to railway defects. Construction and Building Materials, 2020. https://doi.org/10.1016/j.conbuildmat.2019.117217.
2. Al Khafaji FSM, Wan Hasan WZ, Isa MM, Sulaiman N. A HSMDAQ System for Estimating Transfer Function of a DC motor. 2019 IEEE Asia Pacific Conference on Postgraduate Research in Microelectronics and Electronics (PrimeAsia). IEEE; 2019. p. 25–8. https://doi.org/10.1109/PrimeAsia47521.2019.8950719.
3. Mamatov A, Lovlin S. Experimental Estimation of Frequency Response Functions of Precision Servo Drive Systems. 2018 X International Conference on Electrical Power Drive Systems (ICEPDS). IEEE; 2018. p. 1–6. https://doi.org/10.1109/ICEPDS.2018.8571854
4. Petojević Z, Gospavić R, Todorović G. Estimation of thermal impulse response of a multi-layer building wall through in-situ experimental measurements in a dynamic regime with applications. Appl Energy. 2018 Oct; 228: 468–86. https://doi.org/10.1016/j.apenergy.2018.06.083.
5. Srikrishnan TA, Rao BD, Giri R, Zhang T. Improved Noise Characterization for Relative Impulse Response Estimation. 2018 IEEE International Conference on Acoustics, Speech and Signal Processing (ICASSP). IEEE; 2018. p. 411–5. https://doi.org/10.1109/ICASSP.2018.8462494
6. Muscheites A, Leckschat D, Epe C. Line Array Sound Reinforcement Systems using Air Motion Transformer. Acta Acustica united with Acustica. 2016 May 1;102(3):592–9. https://doi.org/10.3813/AAA.918976.
7. Lee H. Multichannel 3D Microphone Arrays: A Review. J Audio Eng Soc. 2021 Feb 24;69(1/2):5-26. https://doi.org/10.17743/jaes.2020.0069
8. Busquet F, Efthymiou F, Hildebrand C. Voice analytics in the wild: Validity and predictive accuracy of common audio-recording devices. Behav Res. 2023 May 30;56(3):2114-34. https://doi.org/10.3758/s13428-023-02139-9.
9. Verburg SA, Fernandez-Grande E. Reconstruction of the sound field in a room using compressive sensing. J Acoust Soc Am. 2018 Jun 1;143(6):3770–9. https://doi.org/10.1121/1.5042247.
10. Carini A, Cecchi S, Romoli L. Robust Room Impulse Response Measurement Using Perfect Sequences for Legendre Nonlinear Filters. IEEE/ACM Trans Audio Speech Lang Process. 2016 Nov;24(11):1969–82. https://doi.org/10.1109/TASLP.2016.2593803.
11. Tang Z, Morales N, Manocha D. Dynamic Sound Field Synthesis for Speech and Music Optimization. Proceedings of the 26th ACM international conference on Multimedia. New York, NY, USA: ACM; 2018. p. 1901–9. https://doi.org/10.1145/3240508.3240644.
12. Schoukens J, Godfrey K, Schoukens M. Nonparametric Data-Driven Modeling of Linear Systems: Estimating the Frequency Response and Impulse Response Function. IEEE Control Syst. 2018 Aug;38(4):49–88. https://doi.org/10.1109/MCS.2018.2830080
FINANCING
The authors did not receive financing for the development of this research.
CONFLICT OF INTEREST
The authors declare that there is no conflict of interest.
AUTHORSHIP CONTRIBUTION
Conceptualization: Angelo J. Soto-Vergel, Oriana A. Lopez-Bustamante, Byron Medina-Delgado.
Research: Angelo J. Soto-Vergel, Oriana A. Lopez-Bustamante, Byron Medina-Delgado.
Formal analysis: Angelo J. Soto-Vergel, Oriana A. Lopez-Bustamante, Byron Medina-Delgado.
Writing – Original Draft: Angelo J. Soto-Vergel, Oriana A. Lopez-Bustamante, Byron Medina-Delgado.
Writing – proofreading and edition: Angelo J. Soto-Vergel, Oriana A. Lopez-Bustamante, Byron Medina-Delgado.