doi: 10.56294/dm2023122
ORIGINAL
Implementation and evaluation of an oncological case management system among public and private healthcare providers in Chile
Implementación y evaluación de sistema de gestión de casos oncológicos entre prestadores de salud públicos y privados en Chile
Sergio Peñafiel1 ![]() *, Analia Hurtado2 *, Marcela Aguirre1
*, Analia Hurtado2 *, Marcela Aguirre1![]() *, Inti Paredes1 *, Vladimir Pizarro2 *
*, Inti Paredes1 *, Vladimir Pizarro2 *
1Medical Informatics and Data Science unit, Department of Cancer Research, Instituto Oncológico Fundación Arturo López Pérez, Rancagua 795, Santiago, Chile.
2Public Affairs unit, Instituto Oncológico Fundación Arturo López Pérez, Rancagua 795, Santiago, Chile.
Cite as: Peñafiel S, Hurtado A, Aguirre M, Paredes I, Pizarro V. Implementation and evaluation of an oncological case management system among public and private healthcare providers in Chile. Data and Metadata 2023;2:122. https://doi.org/10.56294/dm2023122.
Submitted: 02-09-2023 Revised: 30-10-2023 Accepted: 10-12-2023 Published: 11-12-2023
Editor: Prof.
Dr. Javier González Argote ![]()
ABSTRACT
This article presented the implementation, results, and usability evaluation of a software solution designed to manage oncological cases between healthcare centers. The software was developed to facilitate the exchange of clinical and administrative data for patients referred to the Arturo López Peréz Foundation (FALP) through a charitable program. The software underwent iterative development and included features such as user roles, patient list, progress tracking, document upload and viewer, chat, DICOM viewer, sharing, download, and API integration. The usability of the software was evaluated using the System Usability Scale (SUS) questionnaire, which showed high levels of usability and user satisfaction. The software proved successful in facilitating the coordination and continuity of care for patients referred to FALP and received positive feedback from users. The results of this study highlight the effectiveness and value of the software solution in improving case management and information exchange in the Chilean healthcare system. Future plans include expanding the software for internal patient management at FALP and extending its use to other institutions.
Keywords: Management Systems; Usability; Cancer; Decision Making.
RESUMEN
Este artículo presenta la implementación, resultados y evaluación de usabilidad de una solución informática diseñada para gestionar casos oncológicos entre centros sanitarios. El software se desarrolló para facilitar el intercambio de datos clínicos y administrativos de pacientes derivados a la Fundación Arturo López Peréz (FALP) a través de un programa benéfico. El software fue sometido a un desarrollo iterativo e incluyó características como roles de usuario, lista de pacientes, seguimiento de progresos, carga y visor de documentos, chat, visor DICOM, intercambio, descarga e integración API. La usabilidad del software se evaluó mediante el cuestionario System Usability Scale (SUS), que mostró altos niveles de usabilidad y satisfacción de los usuarios. El software demostró su eficacia a la hora de facilitar la coordinación y la continuidad de la atención a los pacientes derivados a la FALP y recibió comentarios positivos de los usuarios. Los resultados de este estudio destacan la eficacia y el valor de la solución informática para mejorar la gestión de casos y el intercambio de información en el sistema sanitario chileno. Los planes futuros incluyen la expansión del software para la gestión interna de pacientes en la FALP y la ampliación de su uso a otras instituciones.
Palabras clave: Sistemas De Gestión; Usabilidad; Cáncer; Toma De Decisiones.
INTRODUCTION
The Chilean healthcare system is mixed, where a patient can receive treatment from both private providers, with or without profit, and public institutions that are part of the provider network of the Ministry of Health. This system is characterized by its fragmentation, resulting in limitations in patient information and challenging communication, coordination, and case management among healthcare providers.(1)
The Arturo López Peréz Foundation (FALP) is one of the main private oncology providers, which receives patients from all over the country and provides treatment for all types of cancer. The Chilean public health insurance system (FONASA) provides coverage for specific types of cancer through the explicit health care guarantees (GES) program.(2) However, GES coverage is limited to certain types of cancers, such as bladder cancer and breast cancer, among others. This means that many other types of cancer, including endometrial cancer and melanomas, are not covered by the GES program. In 2020, FALP initiated a charitable program aimed to provide treatment to patients diagnosed with non-GES cancers who were on the FONASA waiting list for treatment.
The patients referred to FALP through this program had already been diagnosed, confirmed, and evaluated for treatment at their respective healthcare centers within the public system. To ensure optimal evaluation and treatment, it was crucial to have a timely and efficient mechanism to exchange clinical and administrative data from these centers to FALP. This allowed for seamless coordination and continuity of care between the originating healthcare centers and FALP, ensuring that the patients received the necessary evaluation and treatment without any delays or information gaps.(3)
This article presents the implementation, results, and usability evaluation of a software solution designed to manage oncological cases between healthcare centers applied to the previously mentioned program.
METHODS
This section is divided into two subsections: first, the description of the software and its development, and then the instrument used to evaluate the application.
Software Development
The software development process followed traditional software engineering methodologies.(4) It began with meetings involving key actors, including many of the future software users. These meetings helped gain a comprehensive understanding of the process and its requirements. Subsequently, the process was mapped into a flowchart, identifying the activities to be performed at each stage and a requirement document which specifies the functional and non-functional requirements of the software.(5) All the necessary documentation supporting the activities was shared with the development team. The development itself was divided into two main phases.
An agile development methodology was adopted,(6) with weekly meetings held with the users to ensure the quality and consistency of the software's development. This approach allowed for frequent feedback and iterative improvements. The first version of the software was made available two months after the start of the project.
Based on user feedback, incremental features were added to the software in later iterations. This iterative approach ensured that the software was continuously refined and enhanced to meet the evolving needs of the users and optimize its functionality.
The main features of the software includes:
● Users and roles: all the functionalities of the application require users to be logged in. User credentials were manually created to ensure that they are oncological referents. The application has several specific roles and permissions. For example, we have one role that allows viewing all the information of a patient for a hospital, while another role can read and add data to patients within a certain hospital network.
● Patient list: a list of patients is presented to users as the initial view of the application. This list displays relevant information about each patient, including their identification number, the referral institution of origin, the diagnosis, and the current state. The list primarily includes active patients, but it also offers filters to view past treated patients. It's important to note that users can only view patients based on their assigned roles and permissions.
● Progress: the patients follow a customized workflow during their participation in the program. This workflow takes into consideration the following states: created, admitted, rejected, in evaluation, in treatment, and discharged. In both the patient detailed view and the patient list, users can see the current state of the patients.
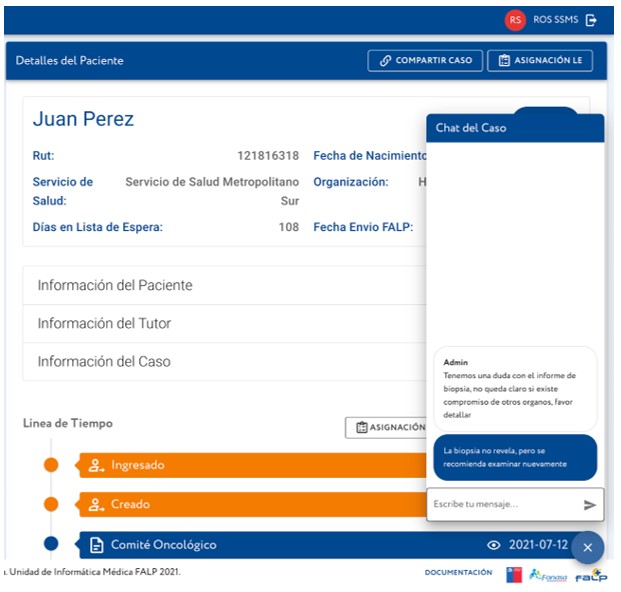
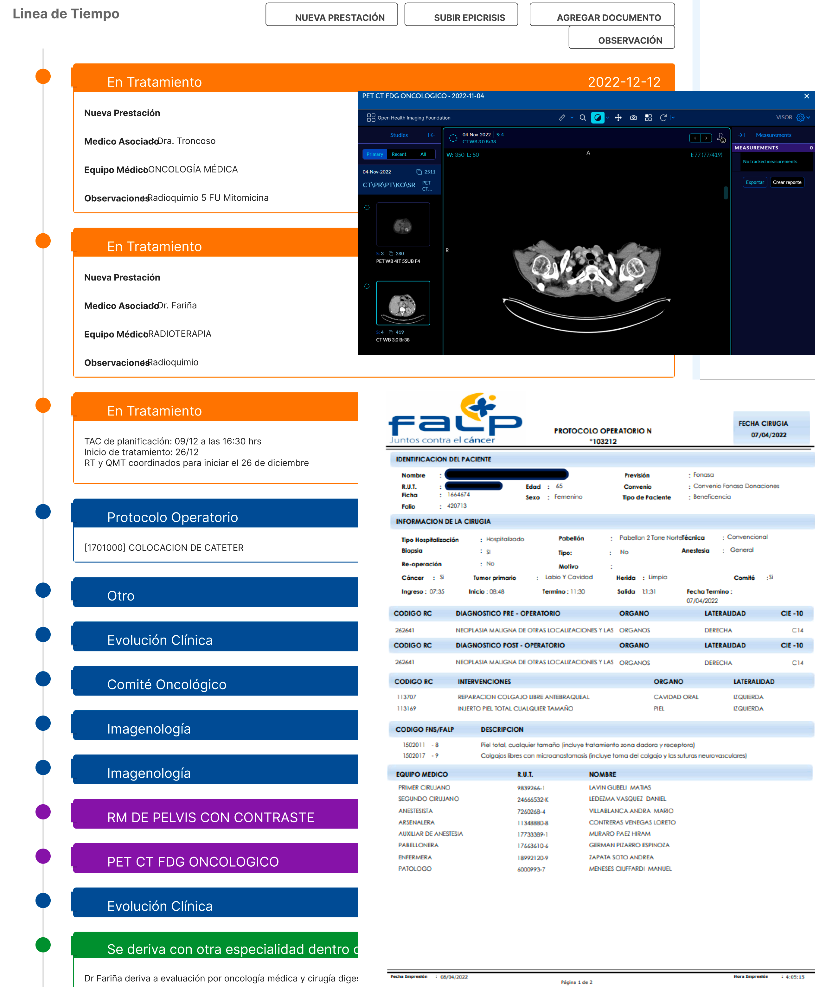
● Timeline: in the patient's detailed view, there is a timeline that compiles all the events that occur during the patient's treatment. Each document, such as exams or medical reports, is uploaded to the timeline, along with state changes and the patient's progress. All of these events are sorted by date, with the most recent ones displayed at the beginning.
● Document Upload and Viewer: the system allows users to upload various types of documents, including exam results, appointments, referral requests, medical reports, tumor board results, treatment plans, discharge reports, and others. These documents can be in PDF, image, or any other format. The documents are presented in the timeline, and the system provides a viewer that allows users to visualize them without the need to download the files. The uploading of files can be done by both the referrer and the case manager at FALP, providing a systematic way of exchanging clinical information.
● Chat: in the patient's detailed view, there is a simple chat feature that allows any user with access to the patient to send messages. This chat can be used for making more specific requests and avoiding the use of emails. Users have access to all the contextual information while using the chat.
● DICOM Viewer: similar to the document viewer, the system also offers a DICOM viewer specifically designed for imagenology and nuclear medicine exams conducted at FALP. This viewer provides a lightweight interface that allows users to manipulate imaging results, similar to other DICOM software.
● Sharing: the patient's detailed view can be shared with anyone without requiring an account in the system. This generates a unique link that enables the user to access a subset of the patient's information. This feature was primarily designed to provide a view of the patient's progress to practitioners in the origin referral institution.
● Download: an Excel file containing all the information of the referred patient can be downloaded directly from the software. This feature can be utilized to generate reports by utilizing the data stored in the system.
● API Integrations: the system provides an API for all of the actions done in the application from creating new patients, uploading documents, checking patient progress, etc. This allows third party applications to connect to the system.
Figure 1 presents a screenshot of the patient's detailed view.
|
|
|
|||
|
Figure 1. Screenshot of the patient detailed view of the management software |
||||
The initial version of the application underwent a testing period with the system's end users. During a two-week period, users were required to create mock patients in the system, while the FALP manager uploaded artificial information for these patients. This process was monitored by the developing team. This process allowed all users to become familiar with the application. The testing period was successful, and following its conclusion, all testing data was deleted before the official launch of the application.
Software Evaluation
To measure the usability of the software solution, the System Usability Scale (SUS) instrument was applied. The SUS is a widely used questionnaire-based tool for assessing the perceived usability of software systems.(7) It consists of a 10-item Likert scale questionnaire that measures aspects such as ease of use, learnability, efficiency, and overall user satisfaction.
The survey questions were designed on a scale from 0 to 4, where 0 represents total disagreement and 4 indicates full agreement. These questions were intentionally intercalated between positive and negative aspects to avoid bias in the responses and to encourage respondents to carefully read and consider each question.
To compute the total score, the sum of each answer was calculated after shifting the inverted responses. The formula used to calculate the SUS score was: SUS Score = (Sum of Answers) * 2,5. This scoring method produces a score ranging from 0 to 100, which serves as a measure of the system's usability. A score of 0 represents a completely unusable system, while a score of 100 indicates a perfectly usable system.
The median SUS score for all systems is 68 points, providing a benchmark for comparing the usability of different systems. Table 1 shows the values of SUS for the most relevant percentiles.(8)
|
Table 1. SUS scores, percentiles and interpretation |
||
|
SUS Score |
Percentile |
Adjective |
|
84,1 - 100 |
96 -100 |
Best Imaginable |
|
80,8 - 84,0 |
90 - 95 |
Excellent |
|
78,9 - 80,7 |
85 - 89 |
Outstanding |
|
77,2 - 78,8 |
80 - 84 |
Very good |
|
74,1 – 77,1 |
70 – 79 |
Good |
|
72,6 – 74,0 |
65 – 69 |
Good |
|
71,1 – 72,5 |
60 – 64 |
Above Average |
|
65,0 – 71,0 |
41 – 59 |
Average |
|
62,7 – 64,9 |
35 – 40 |
Below average |
|
51,7 – 62,6 |
15 – 34 |
Fair |
|
25,1 – 51,6 |
2 – 14 |
Poor |
|
0-25 |
0 - 1,9 |
Worst Imaginable |
In addition to the SUS, other custom questions were included in the survey to gather feedback on the benefits of using the platform and the functionalities that enhance case management. Table 2 shows the final questionnaire applied to the participants.
|
Table 2. Usability questionnaire |
||
|
N |
Question |
Type |
|
1 |
I would like to use this application more frequently than other systems |
SUS |
|
2 |
I find the application is unnecessarily complex |
SUS |
|
3 |
I think the application is easy to use |
SUS |
|
4 |
I think I would need technical support to use the application |
SUS |
|
5 |
I find that the various functions of the application are well integrated |
SUS |
|
6 |
I think there is too much inconsistency in the application |
SUS |
|
7 |
I imagine that most people would learn very quickly to use the application |
SUS |
|
8 |
I find that the application is very cumbersome to use |
SUS |
|
9 |
I feel very confident using the application |
SUS |
|
10 |
I need to learn many things before I could get going with this system |
SUS |
|
11 |
I think the application worsens patient care times |
Custom |
|
12 |
I think the application improves the quality of care received by patients |
Custom |
|
13 |
I would like to use the application for the monitoring of other patients |
Custom |
|
14 |
I consider that the application improves the exchange of information between providers and health institutions |
Custom |
After 18 months of use, the survey was sent digitally to 58 case managers from public institutions responsible for referring cases to FALP. Out of the recipients, 22 users responded, providing valuable insights into the usability and impact of the software solution.
The collected data were analyzed to calculate the average SUS score, which provides a quantitative measure of the perceived usability of the software. Confidence intervals were also calculated to determine the range within which the true average SUS score falls. Furthermore, the survey responses were examined to identify specific areas where the software has been beneficial and any areas where improvements could be made.
RESULTS
In this section we present the results of the implementation and evaluation of the software after 2 years from the move to production. These results are divided into 2 subsections. First, we will show the production in terms of the amount of cases analyzed, treatment performed and documents shared. And then we will present the results of the usability test performed.
Production Results
As of June 2023, a total of 909 patients have been referred to our program. Out of these, 676 patients were accepted, while 233 patients were rejected due to not meeting the necessary conditions. Currently, 443 patients have either completed or are currently undergoing treatment. However, there were 233 patients who were accepted into the program but are not actively participating in treatment, primarily because they treat their cancer disease at another institution.
During the diagnosis confirmation and staging phase, a comprehensive approach was taken. This involved a total of 2661 medical appointments with specialists, 1931 imaging exams, and 457 nuclear medicine exams. Additionally, 619 tumor boards were conducted, where a committee of specialists from various fields would collaborate to determine the best treatment plan for each individual case.
Furthermore, in the treatment phase, a significant number of procedures were performed. This includes 531 surgeries, 1900 radiotherapy sessions, and 602 chemotherapy sessions. These treatments collectively accounted for a total of 1602 hospitalization days.
Overall, our program has made substantial progress in providing care and treatment to patients who do not have coverage guaranteed by the public system.
Usability Results
Figure 2 shows the cumulative results of the application of the SUS questionnaire separated by each question. Negated questions are shifted to that the highest category is comparable among all the questions.
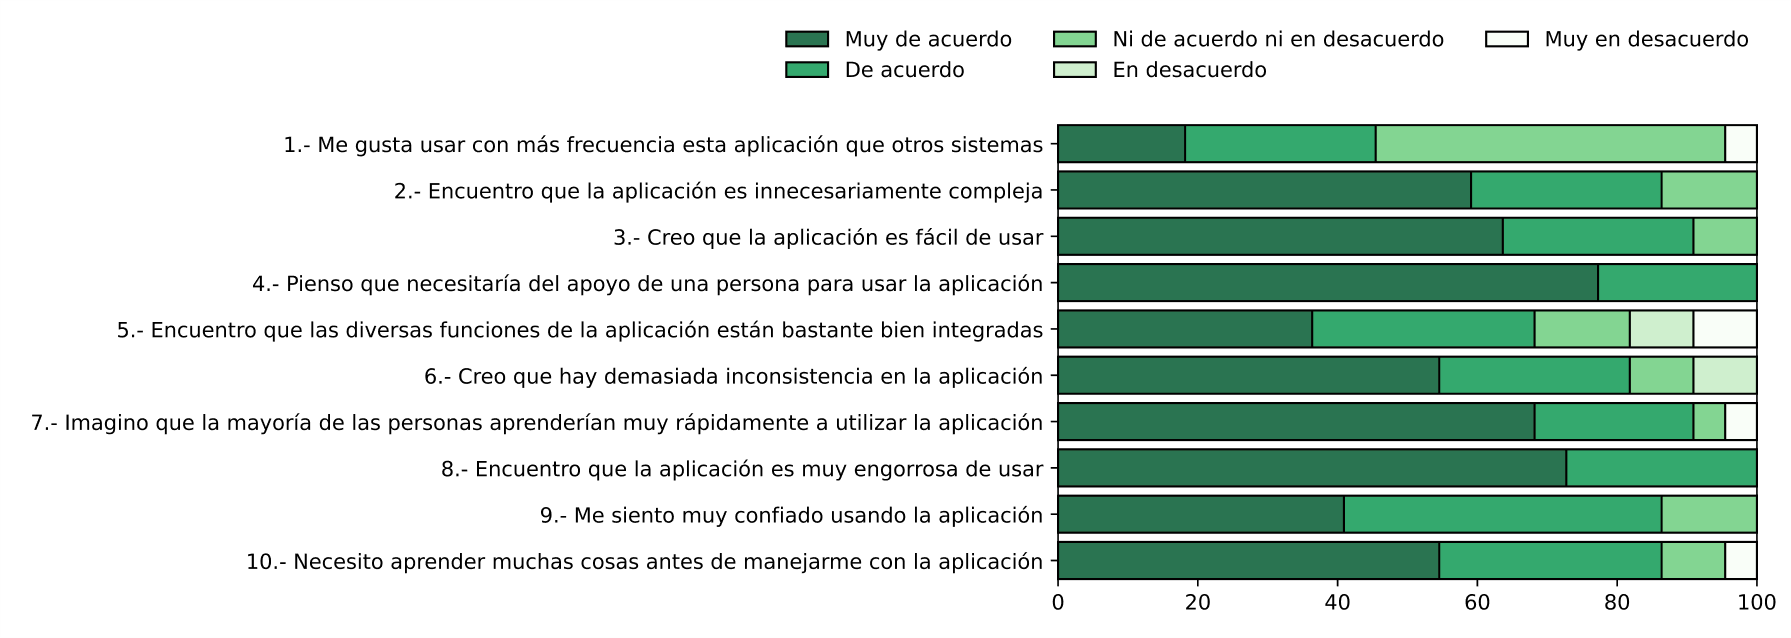
Figure 2. SUS cumulative results by question
From figure 2 we can see that the “Strongly agree” category is the majority for most of the questions and “Strongly disagree” rarely appears. The average SUS score obtained was 82,95 (95% CI: 78,6 - 87,3), corresponding to the 90 - 95 percentile range in the SUS ranking according to table 1. This result positions the software into the category of excellent usability.
Based on user answers to the custom questions, it can also be concluded that the application does not worsen management times (82 %). It also does not affect the quality of care (70 %). Users consider that the software improves the exchange of information between providers and for internal management (85 %). Additionally, 92 % of users expressed a desire to use this software for managing other cases.
DISCUSSION
From the results presented in the previous section, it can be observed that the software achieved the goal of exchanging clinical information for the charity agreement. The production results indicate that the application had a high usage rate, with over 900 patients referred and more than 80 active users from different institutions nationwide. This implies that there is extensive software validation and a high level of maturity, unlike evaluations of other software that are only conducted with a few users in test environments.
From the usability results, it can be noticed that the software achieves a high level of usability, ranking in the 90 - 95 percentile. This corresponds to a very high value, especially for healthcare applications where the usability and acceptability of systems tend to be lower. Based on this result, we can verify that the software's functionalities such as the timeline and the document viewers, along with the way information is visualized, prove to be simple and effective in displaying the required data and improving management.
From the results of the additional questions, we can state that the system does not negatively interfere with patient care. In fact, users see that the application adds value and believe that it helps case management.(8,9,10) This is an unusual finding in health information systems, as many users believe that these systems hinder patient care and do not always see the value they provide. In this case, many users found the system to be so good that they would like to use it for managing referrals of other patients.
CONCLUSION
From the work conducted, it can be observed that the software successfully fulfills its objective of being a high-quality solution for the exchange of clinical information. It is believed that the functionalities and information visualization methods employed are effective and can serve as a valuable reference for future similar projects. The team is currently engaged in expanding the software for other applications, including internal patient management at FALP and extension for additional agreements. Furthermore, invitations have been extended to representatives from other institutions who have expressed interest in utilizing the software for other purposes. Complimentary licensing will be provided to these institutions.
REFERENCES
1. Grupo de Trabajo Industria Salud Digital. Salud Digital: Una visión tecnológica para Chile. Available online in this link: https://paisdigital.org/wp-content/uploads/2019/06/Documento-Vision-Grupo-Trabajo-Industria-Salud-1.pdf. June 2018.
2. Ministerio de Salud de Chile. Plan AUGE-GES. Available online in this link: https://www.chileatiende.gob.cl/fichas/2464-plan-auge-ges. July 2023.
3. Almomani I, Alsarheed A. Enhancing outpatient clinics management software by reducing patients’ waiting time. Journal of infection and public health. 2016 Nov 1;9(6):734-43.
4. Despa ML. Comparative study on software development methodologies. Database Systems Journal. 2014 Jul 1;5(3).
5. Attarha M, Modiri N. Focusing on the importance and the role of requirement engineering. InThe 4th International Conference on Interaction Sciences 2011 Aug 16 (pp. 181-184). IEEE.
6. Nerur S, Mahapatra R, Mangalaraj G. Challenges of migrating to agile methodologies. Communications of the ACM. 2005 May 1;48(5):72-8.
7. John B. SUS: a" quick and dirty" usability scale. Usability evaluation in industry. 1996:189-94.
8. Canova-Barrios C, Machuca-Contreras F. Interoperability standards in Health Information Systems: systematic review. Seminars in Medical Writing and Education 2022;1:7–7. https://doi.org/10.56294/mw20227
9. Inastrilla CRA. Big Data in Health Information Systems. Seminars in Medical Writing and Education 2022;1:6–6. https://doi.org/10.56294/mw20226
10. Lewis JR, Sauro J. Item benchmarks for the system usability scale. Journal of Usability Studies. 2018 May 1;13(3).
FINANCING
The authors did not receive financing for the development of this research.
CONFLICT OF INTEREST
The authors declare that there is no conflict of interest.
AUTHORSHIP CONTRIBUTION
Conceptualization: Analia Hurtado and Vladimir Pizarro.
Data curation: Analia Hurtado and Sergio Peñafiel.
Formal analysis: Analia Hurtado and Sergio Peñafiel.
Acquisition of funds: Vladimir Pizarro.
Research: Analia Hurtado and Sergio Peñafiel.
Methodology: Analia Hurtado and Sergio Peñafiel.
Project management: Analia Hurtado.
Resources: Analia Hurtado.
Software: Sergio Peñafiel.
Supervision: Inti Paredes and Vladimir Pizarro.
Validation: Analia Hurtado.
Display: Sergio Peñafiel.
Drafting - original draft: Sergio Peñafiel and Marcela Aguirre.
Writing - proofreading and editing: Sergio Peñafiel and Analia Hurtado.