doi: 10.56294/dm2024.644
ORIGINAL
Optimization of Order Scheduling in the Moroccan Garment Industry for Fast Fashion: A Clustering-Based Approach
Optimización de la programación de pedidos en la industria marroquí de la confección para la moda rápida: Un enfoque basado en la agrupación
Abdelfattah MOULOUD1 ![]() *, Yasmine EL BELGHITI1 *, Samir TETOUANI1 *, Aziz SOULHI2
*, Yasmine EL BELGHITI1 *, Samir TETOUANI1 *, Aziz SOULHI2 ![]() *
*
1Higher School of Textile and Clothing Industries. Casablanca, Morocco.
2National Higher School of Mines of Rabat. Morocco.
Cite as: Mouloud A, El Belghiti Y, Tetouani S, Soulhi A. Optimization of Order Scheduling in the Moroccan Garment Industry for Fast Fashion: A Clustering-Based Approach. Data and Metadata. 2024; 3:.644. https://doi.org/10.56294/dm2024.644
Submitted: 12-06-2024 Revised: 14-09-2024 Accepted: 30-12-2024 Published: 31-12-2024
Editor:
Adrián Alejandro Vitón Castillo ![]()
Corresponding Author: Abdelfattah MOULOUD *
ABSTRACT
The Moroccan garment industry plays a crucial role in the global fast fashion market, requiring efficient, flexible, and timely production to meet evolving consumer demands. However, the scheduling of small order batches presents significant challenges, as it demands skilled operators and strict adherence to On-Time Delivery (OTD) targets. Traditional scheduling methods based on product family groupings often result in frequent and time-consuming changeovers, increasing downtime and reducing operational efficiency by up to 15-20 %.
This paper introduces a novel clustering-based scheduling methodology that organizes production lines by technological times rather than product families. By grouping garments with similar operational requirements, this approach aims to minimize changeover times, streamline production transitions, and reduce downtime by an average of 30-35 %.
A case study conducted in a Moroccan garment factory validates the effectiveness of the proposed approach. The factory, with an average order size of 50-100 units per batch, achieved a 20 % reduction in lead time and a 15 % increase in operator productivity after implementing the clustering-based scheduling. Additionally, the use of clustering methods such as K-Means facilitated the grouping of garments with minimal operational variability, further enhancing planning flexibility and resource utilization.
This study highlights how technological clustering enhances production scheduling in the garment industry. It emphasizes aligning production processes with operational needs to optimize resources and competitiveness in fast fashion. The methodology provides a framework for reducing changeover downtime, boosting productivity, and maintaining agility in a dynamic market.
Keywords: Workload in Minutes; Changeover Downtime; Skill; Planning; Scheduling and Launching; Workstation.
RESUMEN
La industria textil marroquí desempeña un papel crucial en el mercado global de la moda rápida, exigiendo una producción eficiente, flexible y puntual para satisfacer la demanda cambiante de los consumidores. Sin embargo, la programación de pequeños lotes de pedidos presenta importantes desafíos, ya que requiere operadores calificados y un estricto cumplimiento de los objetivos de entrega a tiempo (OTD). Los métodos tradicionales de programación, basados en la agrupación por familias de productos, a menudo generan cambios frecuentes y que consumen mucho tiempo, lo que aumenta los tiempos muertos y reduce la eficiencia operativa hasta en un 15-20 %.
Este artículo presenta una metodología novedosa de programación basada en clustering (agrupamiento) que organiza las líneas de producción según los tiempos tecnológicos, en lugar de las familias de productos. Agrupando prendas con requisitos operativos similares, esta metodología busca minimizar los tiempos de cambio, agilizar las transiciones de producción y reducir los tiempos muertos en un promedio del 30-35 %.Un estudio de caso realizado en una fábrica textil marroquí valida la efectividad del enfoque propuesto. La fábrica, con un tamaño promedio de pedido de 50-100 unidades por lote, logró una reducción del 20 % en los plazos de entrega y un aumento del 15 % en la productividad de los operadores después de implementar la programación basada en clustering. Además, el uso de métodos de agrupamiento como K-Means facilitó la agrupación de prendas con una variabilidad operativa mínima, mejorando así la flexibilidad en la planificación y el uso eficiente de los recursos. Este estudio destaca cómo el agrupamiento tecnológico mejora la programación de producción en la industria textil. Enfatiza la alineación de los procesos productivos con las necesidades operativas para optimizar recursos y competitividad en la moda rápida. La metodología ofrece un marco para reducir tiempos de cambio, aumentar productividad y mantener agilidad en un mercado dinámico.
Palabras clave: Carga de Trabajo en Minutos; Tiempo Muerto por Cambio; Habilidad; Planificación; Programación y Lanzamiento; Estación de Trabajo.
INTRODUCTION
The fast fashion industry currently dominates the global apparel market due to the increasing demand from consumers for trendy products at competitive prices and with short delivery times. This model requires textile companies, including Moroccan factories, to maintain high levels of flexibility and efficiency to meet these demands while adhering to strict On-Time Delivery (OTD) targets.(1) Morocco, thanks to its geographic proximity to European markets and its skilled workforce, holds a strategic position in this industry.(2) However, managing small production batches with customized orders and high variability presents a significant challenge for companies in the sector.(3)
In this context, production scheduling and planning play a critical role in improving operational performance. Traditional methods, which rely mainly on grouping products by families, often prove inefficient when faced with fragmented production demands.(4) These methods result in frequent reconfigurations of production lines, increasing changeover times and causing repeated interruptions.(5) This situation not only decreases productivity but also reduces flexibility, limiting the ability of factories to efficiently handle increasingly diverse orders.
To overcome these challenges, it is essential to adopt innovative scheduling approaches. The use of clustering techniques, particularly the K-means method, offers a promising alternative.(6) Instead of grouping products by families, this method organizes production lines based on technological times. The goal is to reduce downtime and optimize transitions between production batches. By clustering products with similar operational needs, it becomes possible to minimize reconfiguration time, thereby improving production flow and shortening delivery times.(7)
Recent studies have further demonstrated the utility of fuzzy logic in addressing uncertainties in textile production processes. For example, explored how fuzzy logic can predict fabric saturation, offering a robust tool for optimizing production parameters.(8) Similarly, fuzzy logic has proven effective in assessing the difficulty of weaving new fabrics, as highlighted by who emphasized its role in improving operational efficiency and product quality in weaving processes.(9)
This study presents a new scheduling methodology applied to a Moroccan textile factory, aiming to demonstrate the effectiveness of the clustering-based approach. The results highlight significant improvements in productivity, with an average reduction in changeover times of 30-35 % and a 20 % reduction in delivery lead times.(10) Additionally, this approach enables more efficient use of operator skills, enhancing production flexibility while keeping costs optimized.(11)
The introduction of clustering in scheduling processes offers new perspectives for the textile industry, not only in Morocco but also in other countries facing similar challenges. This methodology provides a roadmap for companies seeking to improve their competitiveness in a rapidly evolving global market.(12) Furthermore, this work contributes to the scientific literature by proposing an innovative method for optimizing production systems, aligned with the needs of the fast fashion sector.(13)
Objective: this study aims to develop a more efficient scheduling method by clustering production lines based on technological times rather than product families. The goal is to minimize changeover times and enhance production efficiency, ensuring that small order batches are completed on time.(14)
Literature review
The integration of Artificial Intelligence (AI) into production line balancing has garnered significant attention in recent years due to its potential to revolutionize manufacturing processes. This section reviews the traditional approaches to line balancing, the emergence of AI-driven methodologies, and their applications in enhancing production efficiency.
Traditional Approaches to Line Balancing
Historically, line balancing relied on heuristic methods, such as Ranked Positional Weight (RPW) and Helgeson-Birnie algorithms, which were effective in simple and static production environments.
These methods aim to minimize idle time and ensure an even distribution of workloads across stations.(1,2) However, they exhibit limitations in handling high variability and real-time adjustments in modern manufacturing settings.(3)
The limitations of traditional methods in high-mix, low-volume environments are evident in industries such as apparel and automotive manufacturing, where frequent changes in product design and production requirements lead to inefficiencies. For instance, studies in garment production highlighted that traditional scheduling methods based on product families result in frequent and time-consuming changeovers, reducing operational efficiency by up to 20 %.(4)
Emergence of AI in Production Line Balancing
AI introduces a dynamic and data-driven approach to line balancing, addressing the shortcomings of traditional methods. AI-driven solutions leverage real-time data collection, machine learning models, and advanced optimization algorithms to adapt to changing production conditions and optimize resource allocation.(3,5)
Dynamic Task Allocation: AI systems analyze real-time data from sensors and IoT devices to allocate tasks dynamically across workstations. This reduces bottlenecks and ensures optimal use of machine capabilities and operator skills.(6)
Clustering Techniques: studies on clustering algorithms, such as K-Nearest Neighbors (K-NN) and K- Means, have demonstrated their effectiveness in grouping production tasks with similar operational requirements. This minimizes changeover times and streamlines workflows, particularly in high- variability environments.(7,10)
Fuzzy Logic Applications: recent advancements highlight the role of fuzzy logic in addressing complex decision-making scenarios in textile manufacturing. For example, El Bakkali et al.(8) demonstrated its effectiveness in predicting fabric saturation, offering a robust framework for tackling uncertainties in production processes. Furthermore, Messnaoui et al.(9) conducted a systematic review underscoring the potential of fuzzy logic to optimize operational efficiency and product quality in weaving processes. Similarly, El Bakkali et al.(15) explored the difficulty of weaving new fabrics, showcasing fuzzy logic as a reliable AI tool for modeling production challenges.
Digital Twins and Simulations: the use of digital twins allows for virtual modeling of production processes, enabling manufacturers to test and refine line balancing strategies without disrupting actual operations. This approach has been shown to significantly improve efficiency and reduce downtime.(11,12)
Comparative Analysis of Traditional and AI-Driven Approaches
Research comparing traditional methods with AI-based approaches highlights the superior performance of AI in addressing the complexities of modern manufacturing. For example:
A Moroccan garment factory implementing a clustering-based approach achieved a 20 % reduction in lead time and a 30-35 % decrease in changeover downtime.(13)
AI-driven production scheduling in automotive and apparel industries has resulted in improved throughput and reduced cycle times, thanks to the ability of AI systems to adapt in real-time to fluctuating production demands.(14,16)
Challenges and Opportunities
While AI offers significant advantages, its integration into production systems is not without challenges. High implementation costs, the need for skilled personnel, and data management complexities are common barriers.(17) However, the potential benefits, such as enhanced flexibility, improved resource utilization, and real-time adaptability, underscore the importance of further research and development in this area.(18,19)
METHOD
Traditional Scheduling Approach: The conventional method in the Moroccan garment industry groups production lines by product families. This approach simplifies order allocation but often leads to frequent changeovers as different products require different setups.(20)
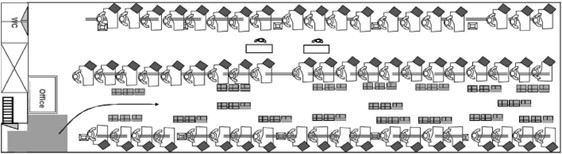
Figure 1. Production line(21)
Proposed Clustering-Based Approach
The new methodology clusters production lines based on technological times, defined as the time required for specific operations or processes. This approach aims to group orders with similar technological requirements, thereby reducing the frequency and duration of changeovers.(19) Clustering by technological times allows the production lines to maintain a smoother workflow, as the need for reconfigurations is minimized, leading to fewer interruptions and a more consistent production pace.(22) This method also enables better utilization of machinery and labor, which contributes to increased productivity and cost efficiency in high-variability environments like the fast fashion sector.(23)

Figure 2. Example of operation
Clustering Algorithm
A clustering algorithm is employed to group orders by technological times. The algorithm considers factors such as the type of fabric, complexity of the design, and required operations. Clusters are formed to minimize the total changeover time between different orders.
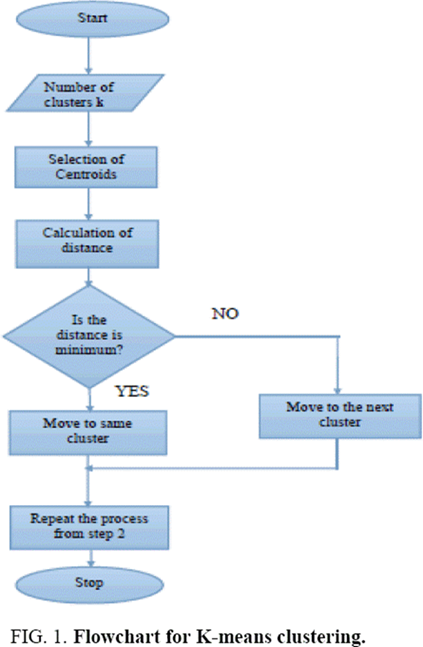
Figure 3. Flowchart for K-means clustering(24)
Cataloguing of homogeneous clusters using dynamic K-means
K-means is one of the simplest unsupervised learning algorithms that solve the well-known clustering problem, which work incredibly well in practice. K-means clustering is a method of vector quantization, originally employed in signal processing, and very popular for cluster analysis in data mining. In this paper, k-means is modified by introducing a novel self-adaptive approach for classification of the identified six fashion attributes. If we let xip be the ith discrete point of a dress P, and yjp be the ith discrete point of dress Q, and i=1,…,k, the classification follows that of Euclidian distance (D) given as:
![]()
These points represent the same features as measured and recorded from both P and Q dresses. The set D of Euclidean distances between dress x and all successive dress y∈Y is calculated using equation 1.
From the distances in the set D, the smallest k distances are selected. The verified designs are classified into three: original, combined and new designs by the classifier. The final classification is established on the basis of a voting score so as to reduce the noise, which depends on the number n of neighbors, given as:

Belonging to any of the three classes. The number of data is a function of the cluster number and the mean vector. For example, if the number of data is less than the number of clusters then we assign each data as the mean vector of the cluster. Therefore, each mean vector will have a cluster number. However, if the number of data is bigger than the number of clusters, for each data, we calculate the distance to all mean vector and obtain the minimum distance. Thus, the data is said to belong to the cluster that has minimum distance from this data.
Since the location of the mean vector cannot be predicted, the mean vector is adjusted based on the current updated data. Thus, we assign all the data to the new mean vector and update the mean vector using a vector update law given as:
![]()
In equation 3, x represents the set of data for clustering. The clusters were then evaluated using the Sum of Squared Error.
![]()
For each point, the error accounts for the distance to the nearest cluster. In order to get the SSE, the error is squared and sum together in equation 4. Let the dimension of the matrix X be l(cxd) as given by equation 2, algorithm 1 describes the generation of new xi.
Case Study Implementation
The proposed method is implemented in a Moroccan garment factory. Historical production data is analysed to identify technological times for various orders. Orders are then clustered using the algorithm, and the resulting schedule is compared to the traditional product family-based schedule.
Measurement of Changeover Downtime
It has been observed that the primary stoppage time that can be optimized concerns workstation changes (machine + operator) within the production lines, specifically, the time elapsed between the production of two items on the same line. This period of inactivity occurs when the machines need to be prepared and repositioned to adapt the line set up for the next product.(25) By reducing this time, known as the “series changeover time,” it is possible to significantly minimize production interruptions.(26) This finding highlights the importance of streamlining changeovers to improve the flow and efficiency of production processes in the workshop.
In this study, the downtimes related to line setup changes during the production of different items on several lines were measured. With an estimated changeover time of 7 minutes per workstation, if the model includes 40 workstations, the total downtime amounts to 7*40, which equals 280 minutes or 4,7 hours. This result underscores that the major issue lies in the downtime associated with line setup changes.(27)
The flow diagram presented below details the process of changing a workstation, from the completion of one series’ production to the validation of the first pieces of the next series. This diagram highlights the various steps involved in the transition, emphasizing the key activities and essential control points to ensure a smooth and efficient transition between production series.(28)
|
Table 1. The process of changing series |
|||||||||||
|
RUN CHART |
|||||||||||
|
Summary |
|||||||||||
|
Objective |
Study of launch times |
Activity |
Current |
||||||||
|
Activity |
Assembly workshop |
Operation |
|
7 |
|||||||
|
Current/proposed |
Current |
Transport |
8 |
||||||||
|
|
Waiting |
4 |
|||||||||
|
Model |
|
Control |
2 |
||||||||
|
Date |
|
Storage |
0 |
||||||||
|
Interne |
Externe |
|
Time |
172 |
|||||||
|
Description |
Quantity |
Time (min) |
|
Symbols |
|||||||
|
|
|
|
|
|
|||||||
|
Transporter looking for ants |
1 |
10 |
10 |
|
|||||||
|
Operators remove tools from the previous model |
30 |
12 |
|
||||||||
|
Operators clean machine |
30 |
10 |
|
||||||||
|
Machine threading operator |
30 |
8 |
0,3 |
||||||||
|
Machine mechanic |
7 |
10 |
1,4 |
||||||||
|
Machine line manager |
8 |
10 |
1,25 |
||||||||
|
Mechanic brings back machine |
2 |
15 |
7,5 |
||||||||
|
Machine mechanic |
2 |
10 |
5 |
||||||||
|
Line manager returns to the station for demonstration |
8 |
7 |
|
||||||||
|
Chain manager back to the start of the chain for control |
1 |
2 |
|
||||||||
|
Station control |
30 |
10 |
0,33 |
||||||||
|
Quality manager validates production |
1 |
7 |
7 |
||||||||
|
Total |
|
111 |
|
7 |
8 |
4 |
2 |
0 |
|||

To ensure the accuracy of the workstation changeover time, we conducted a series of systematic observations, specifically collecting 30 measurements to evaluate the time required for each changeover.(29) The figure below illustrates the results of these 30 observations. The analysis reveals that the average changeover time is 7 minutes per transition.(30) These data provide a solid empirical basis for the workstation changeover time, reinforcing the importance of precise measurement in optimizing production processes.(31)
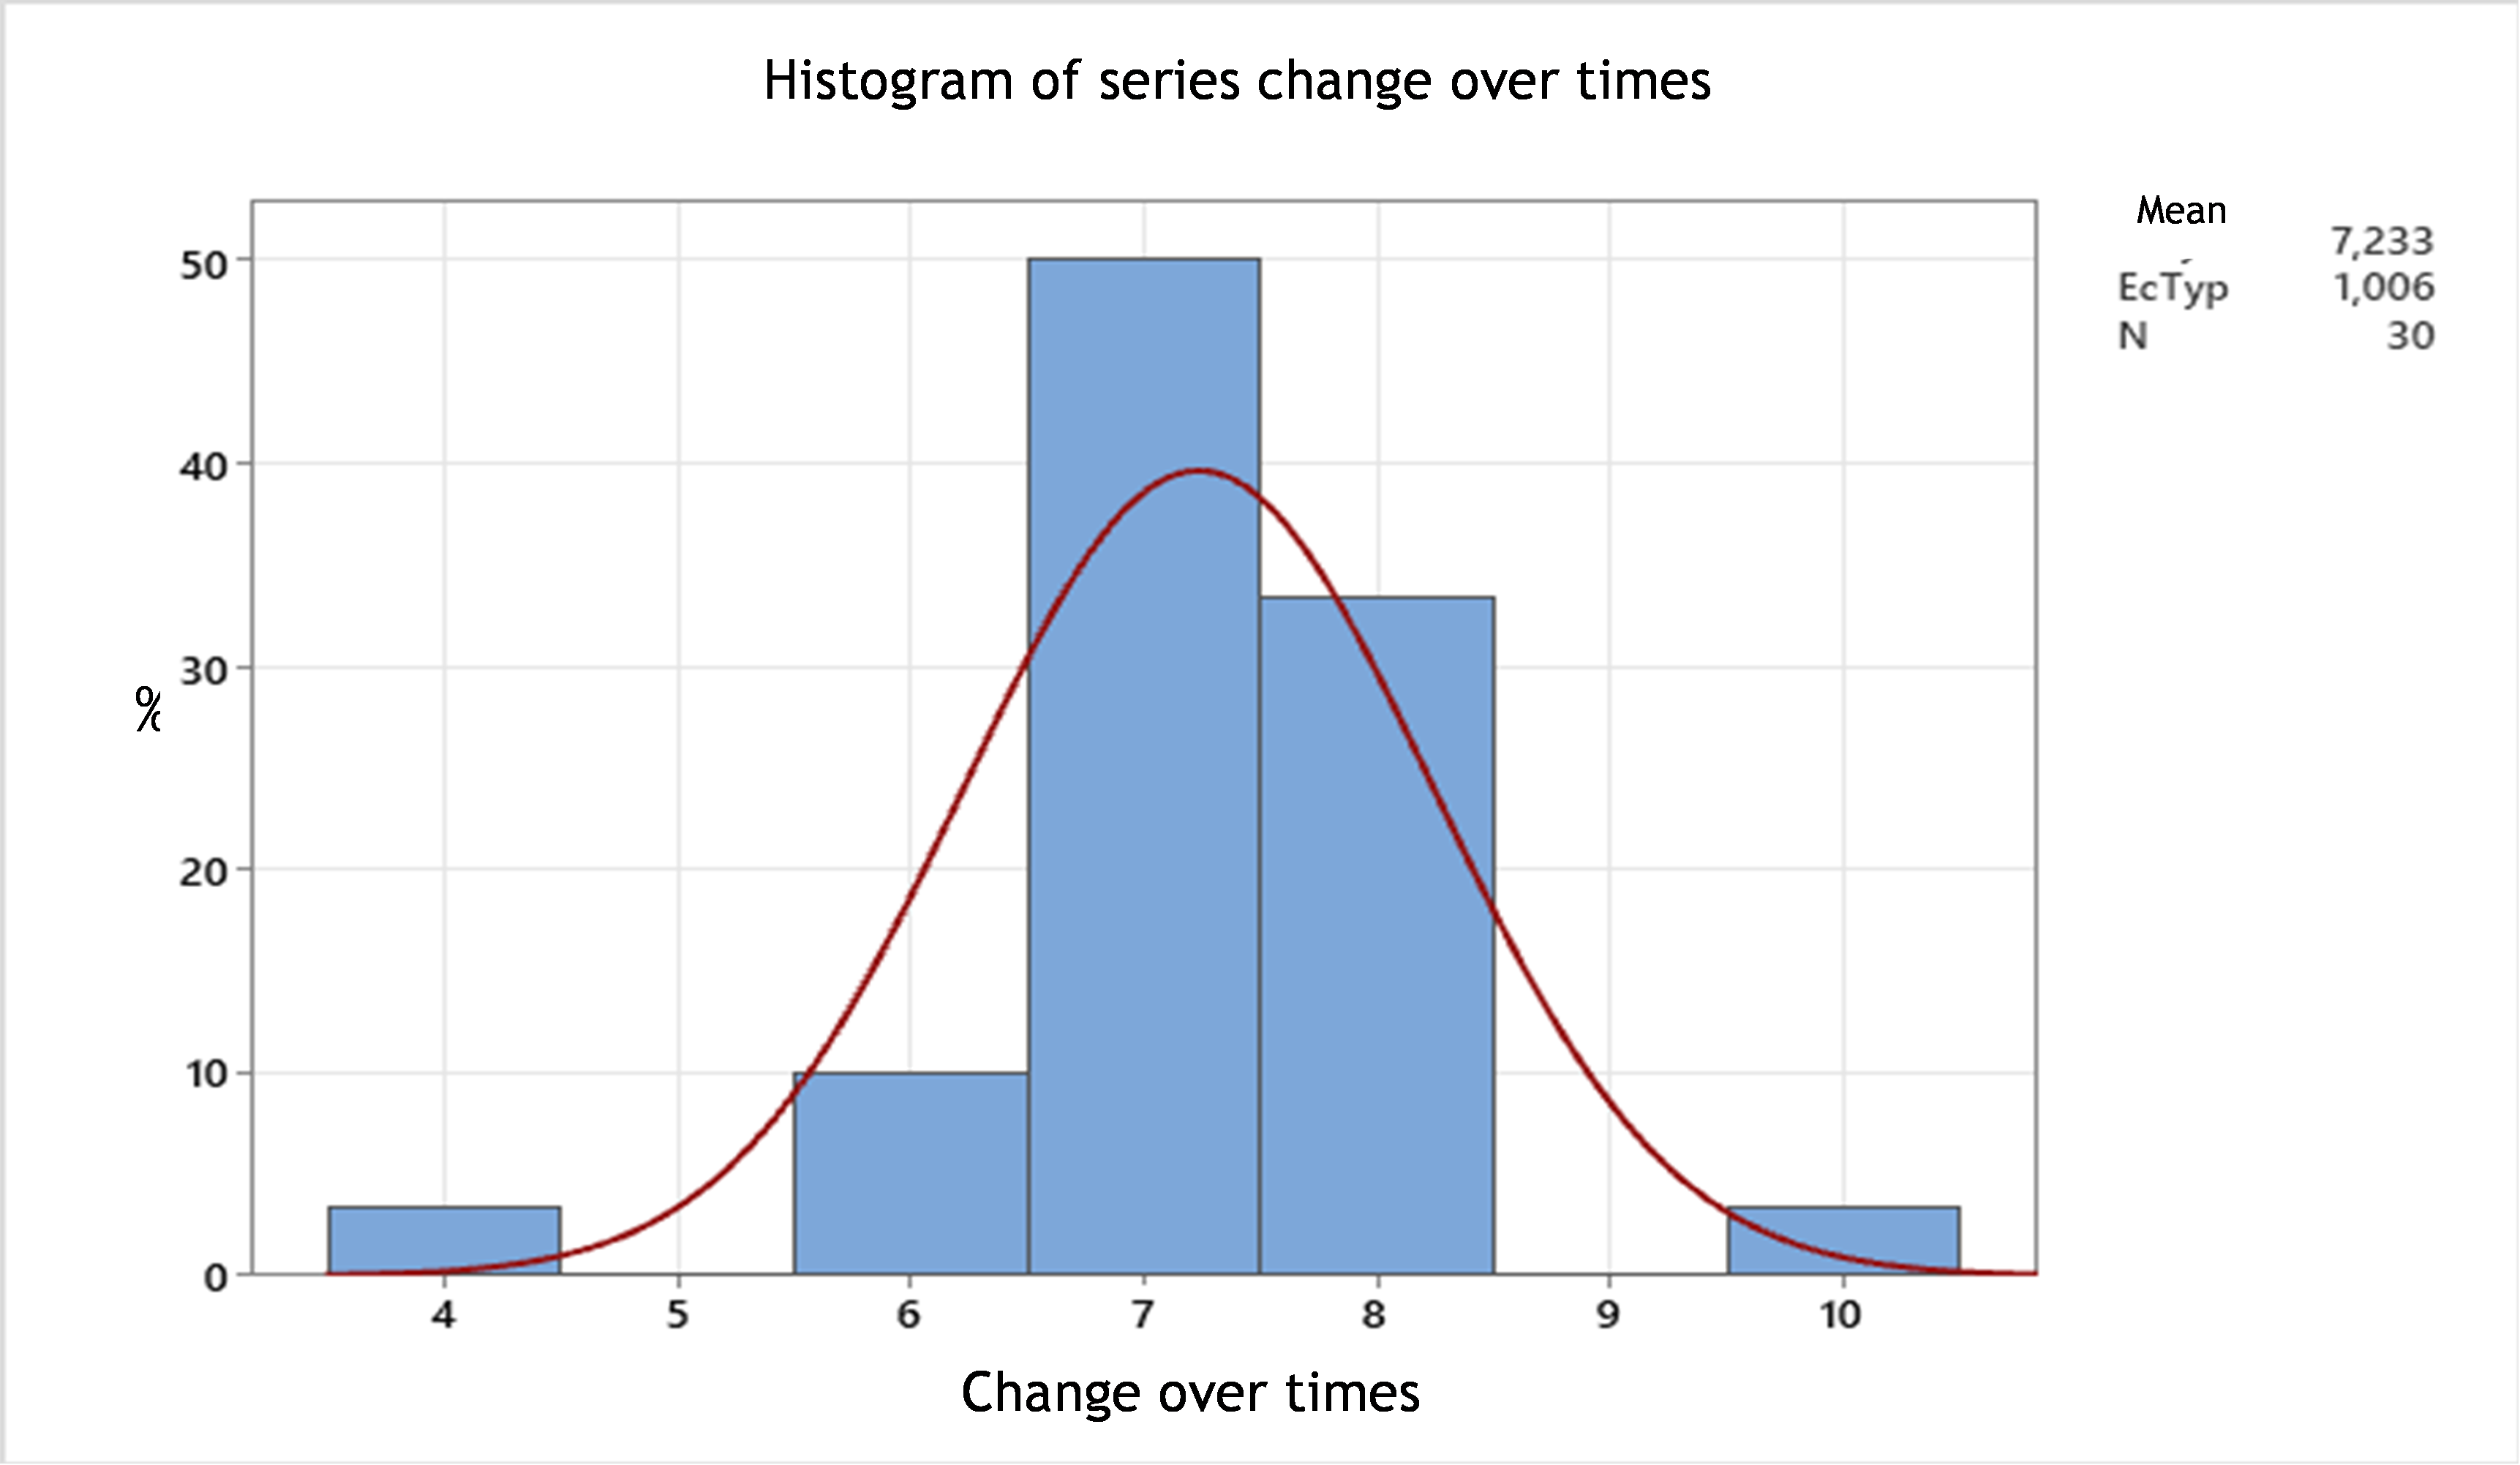
Figure 4. Histogram of changeover times
Methodology: Application for an order book (example of CCX company)
In collaboration with the engineering and methods teams, a database cataloguing the different required skills is essential for optimizing production workflows. This database will integrate both technology-specific skills and operator dexterity. By cataloguing these competencies, we can develop a comprehensive skills matrix that assigns each operator their respective proficiencies. Such a matrix allows for streamlined assignment of tasks based on skill level, ensuring that operations align with the most suited personnel, which in turn reduces idle time and enhances operational efficiency. Furthermore, each production operation will be mapped and associated with the necessary skills, following a structured framework. This approach not only allows for the optimization of resource allocation but also facilitates adaptive scheduling in response to real-time demand variations, which is particularly beneficial in the fast fashion industry.

Figure 5. Methodology Application on an order book(24)
Creation of the versatility matrix for the garment workshop
We have developed a skills versatility matrix for the assembly lines in the garment workshop. This matrix details the specific skills of each operator for each line, highlighting their ability to perform various tasks and handle different equipment.(32) Such skills mapping provides an enhanced visualization of operators’ abilities, enabling a more strategic allocation of resources aligned with production demands and technical requirements.(33) This approach is essential for optimizing workforce flexibility, as it allows management to quickly adjust task assignments based on operators’ proficiencies and specific production line requirements, which is particularly beneficial in high- variability environments such as fast fashion.(34) The ability to swiftly allocate skilled operators contributes significantly to minimizing delays and enhancing overall productivity in garment manufacturing.(35)
|
Table 2. Level skills |
|
|
Qualification Rating |
Levels |
|
Usual operation and/or very well mastered |
3 |
|
Operation performed occasionally but mastered |
2 |
|
Operation previously performed but cannot be repeated without assistance |
1 |
|
Does not know how to do it |
0 |
|
Table 3. Skill matrix (Overview) |
||||||||||||||||
|
Operateur |
Skill |
|||||||||||||||
|
Sliding |
Topstitching |
Pressing |
Securing |
Label attach |
Simple pocke |
Welt pocket |
Piping |
Flaps |
Bias |
Collar assembly |
Collar finishing |
Simple he |
Double folde |
Slits |
Zippers |
|
|
Sajed Mouna |
3 |
3 |
3 |
3 |
2 |
1 |
1 |
1 |
1 |
3 |
1 |
1 |
2 |
1 |
1 |
1 |
|
Souad Mouna |
3 |
3 |
3 |
3 |
3 |
3 |
3 |
3 |
3 |
3 |
3 |
3 |
3 |
3 |
3 |
3 |
|
Jihar Latifa |
0 |
0 |
0 |
0 |
0 |
0 |
0 |
0 |
0 |
0 |
0 |
0 |
0 |
0 |
0 |
0 |
|
Nasri Khadija |
3 |
3 |
3 |
3 |
3 |
3 |
3 |
3 |
3 |
3 |
3 |
3 |
3 |
3 |
3 |
3 |
|
Wagri Essaliha |
3 |
3 |
3 |
3 |
3 |
3 |
2 |
3 |
3 |
3 |
3 |
2 |
3 |
3 |
3 |
3 |
|
Lahssen Hassna |
3 |
3 |
3 |
3 |
3 |
3 |
1 |
3 |
3 |
3 |
3 |
2 |
3 |
3 |
3 |
1 |
|
El Arfaoui Mina |
3 |
3 |
3 |
3 |
2 |
3 |
2 |
2 |
2 |
3 |
3 |
3 |
3 |
3 |
3 |
3 |
|
Abdellaoui Naima |
3 |
3 |
3 |
3 |
3 |
2 |
2 |
2 |
2 |
2 |
2 |
2 |
3 |
2 |
2 |
1 |
|
Nadia |
3 |
3 |
3 |
3 |
3 |
3 |
3 |
3 |
3 |
3 |
3 |
3 |
3 |
3 |
3 |
3 |
|
Laila |
3 |
3 |
3 |
3 |
2 |
2 |
1 |
1 |
1 |
3 |
3 |
3 |
2 |
2 |
2 |
1 |
|
Chekerded Saida |
3 |
3 |
3 |
3 |
3 |
3 |
3 |
3 |
3 |
3 |
3 |
3 |
3 |
3 |
3 |
3 |
|
Belahrache |
3 |
3 |
3 |
3 |
3 |
3 |
3 |
3 |
3 |
3 |
3 |
3 |
3 |
3 |
3 |
3 |
|
Siham |
3 |
3 |
3 |
3 |
3 |
3 |
3 |
3 |
3 |
3 |
3 |
3 |
3 |
3 |
3 |
3 |
|
Rajaa |
3 |
3 |
3 |
3 |
3 |
3 |
3 |
3 |
3 |
3 |
3 |
3 |
3 |
3 |
3 |
3 |
|
Souihel |
3 |
3 |
3 |
3 |
3 |
2 |
2 |
2 |
2 |
3 |
2 |
2 |
3 |
3 |
3 |
3 |
|
Souad |
1 |
1 |
1 |
1 |
0 |
0 |
0 |
0 |
0 |
0 |
0 |
0 |
0 |
0 |
0 |
0 |
|
Nadia |
1 |
2 |
2 |
2 |
0 |
0 |
0 |
0 |
0 |
2 |
0 |
0 |
0 |
0 |
0 |
0 |
|
Samira |
3 |
3 |
3 |
3 |
3 |
3 |
3 |
3 |
3 |
3 |
3 |
3 |
3 |
3 |
3 |
2 |
Each row of this table lists the names of the operators, which can be modified based on new arrivals or departures within the workshop. The columns represent the skills previously defined in collaboration with the engineering team. This method of defining skills can also serve as a basis for future improvements that may be explored in other scientific work.
Analysis of the company’s order book by type of operation and creation of a database
We developed a table where each row corresponds to a specific operation, associated with a type of garment and a dedicated machine, specifying the technical skills required for each task. The times allocated to each operation are also specified; see an example of some operations for the AURORE 802 H garment.
|
Table 4. The process of changing series |
|||||
|
Garment |
Operation |
Product Family |
Equipment |
Skill |
Standard allocated munite |
|
AURORE 802 H |
Measure and cut neckline band |
PYJ_ |
Manual |
Manual |
0,4 |
|
AURORE 802 H |
Assemble neckline band |
PYJ_ |
Sewing machine |
Assembly |
0,4 |
|
AURORE 802 H |
Attach front neckline tape |
PYJ_ |
Sewing machine |
Collar assembly |
1,5 |
|
AURORE 802 H |
Notch |
PYJ_ |
Manual |
Manual |
0,2 |
|
AURORE 802 H |
Overlock neckline band |
PYJ_ |
3-thread overlocker |
Overlocking |
0,6 |
|
AURORE 802 H |
Secure overlock edge |
PYJ_ |
Sewing machine |
Securing |
0,2 |
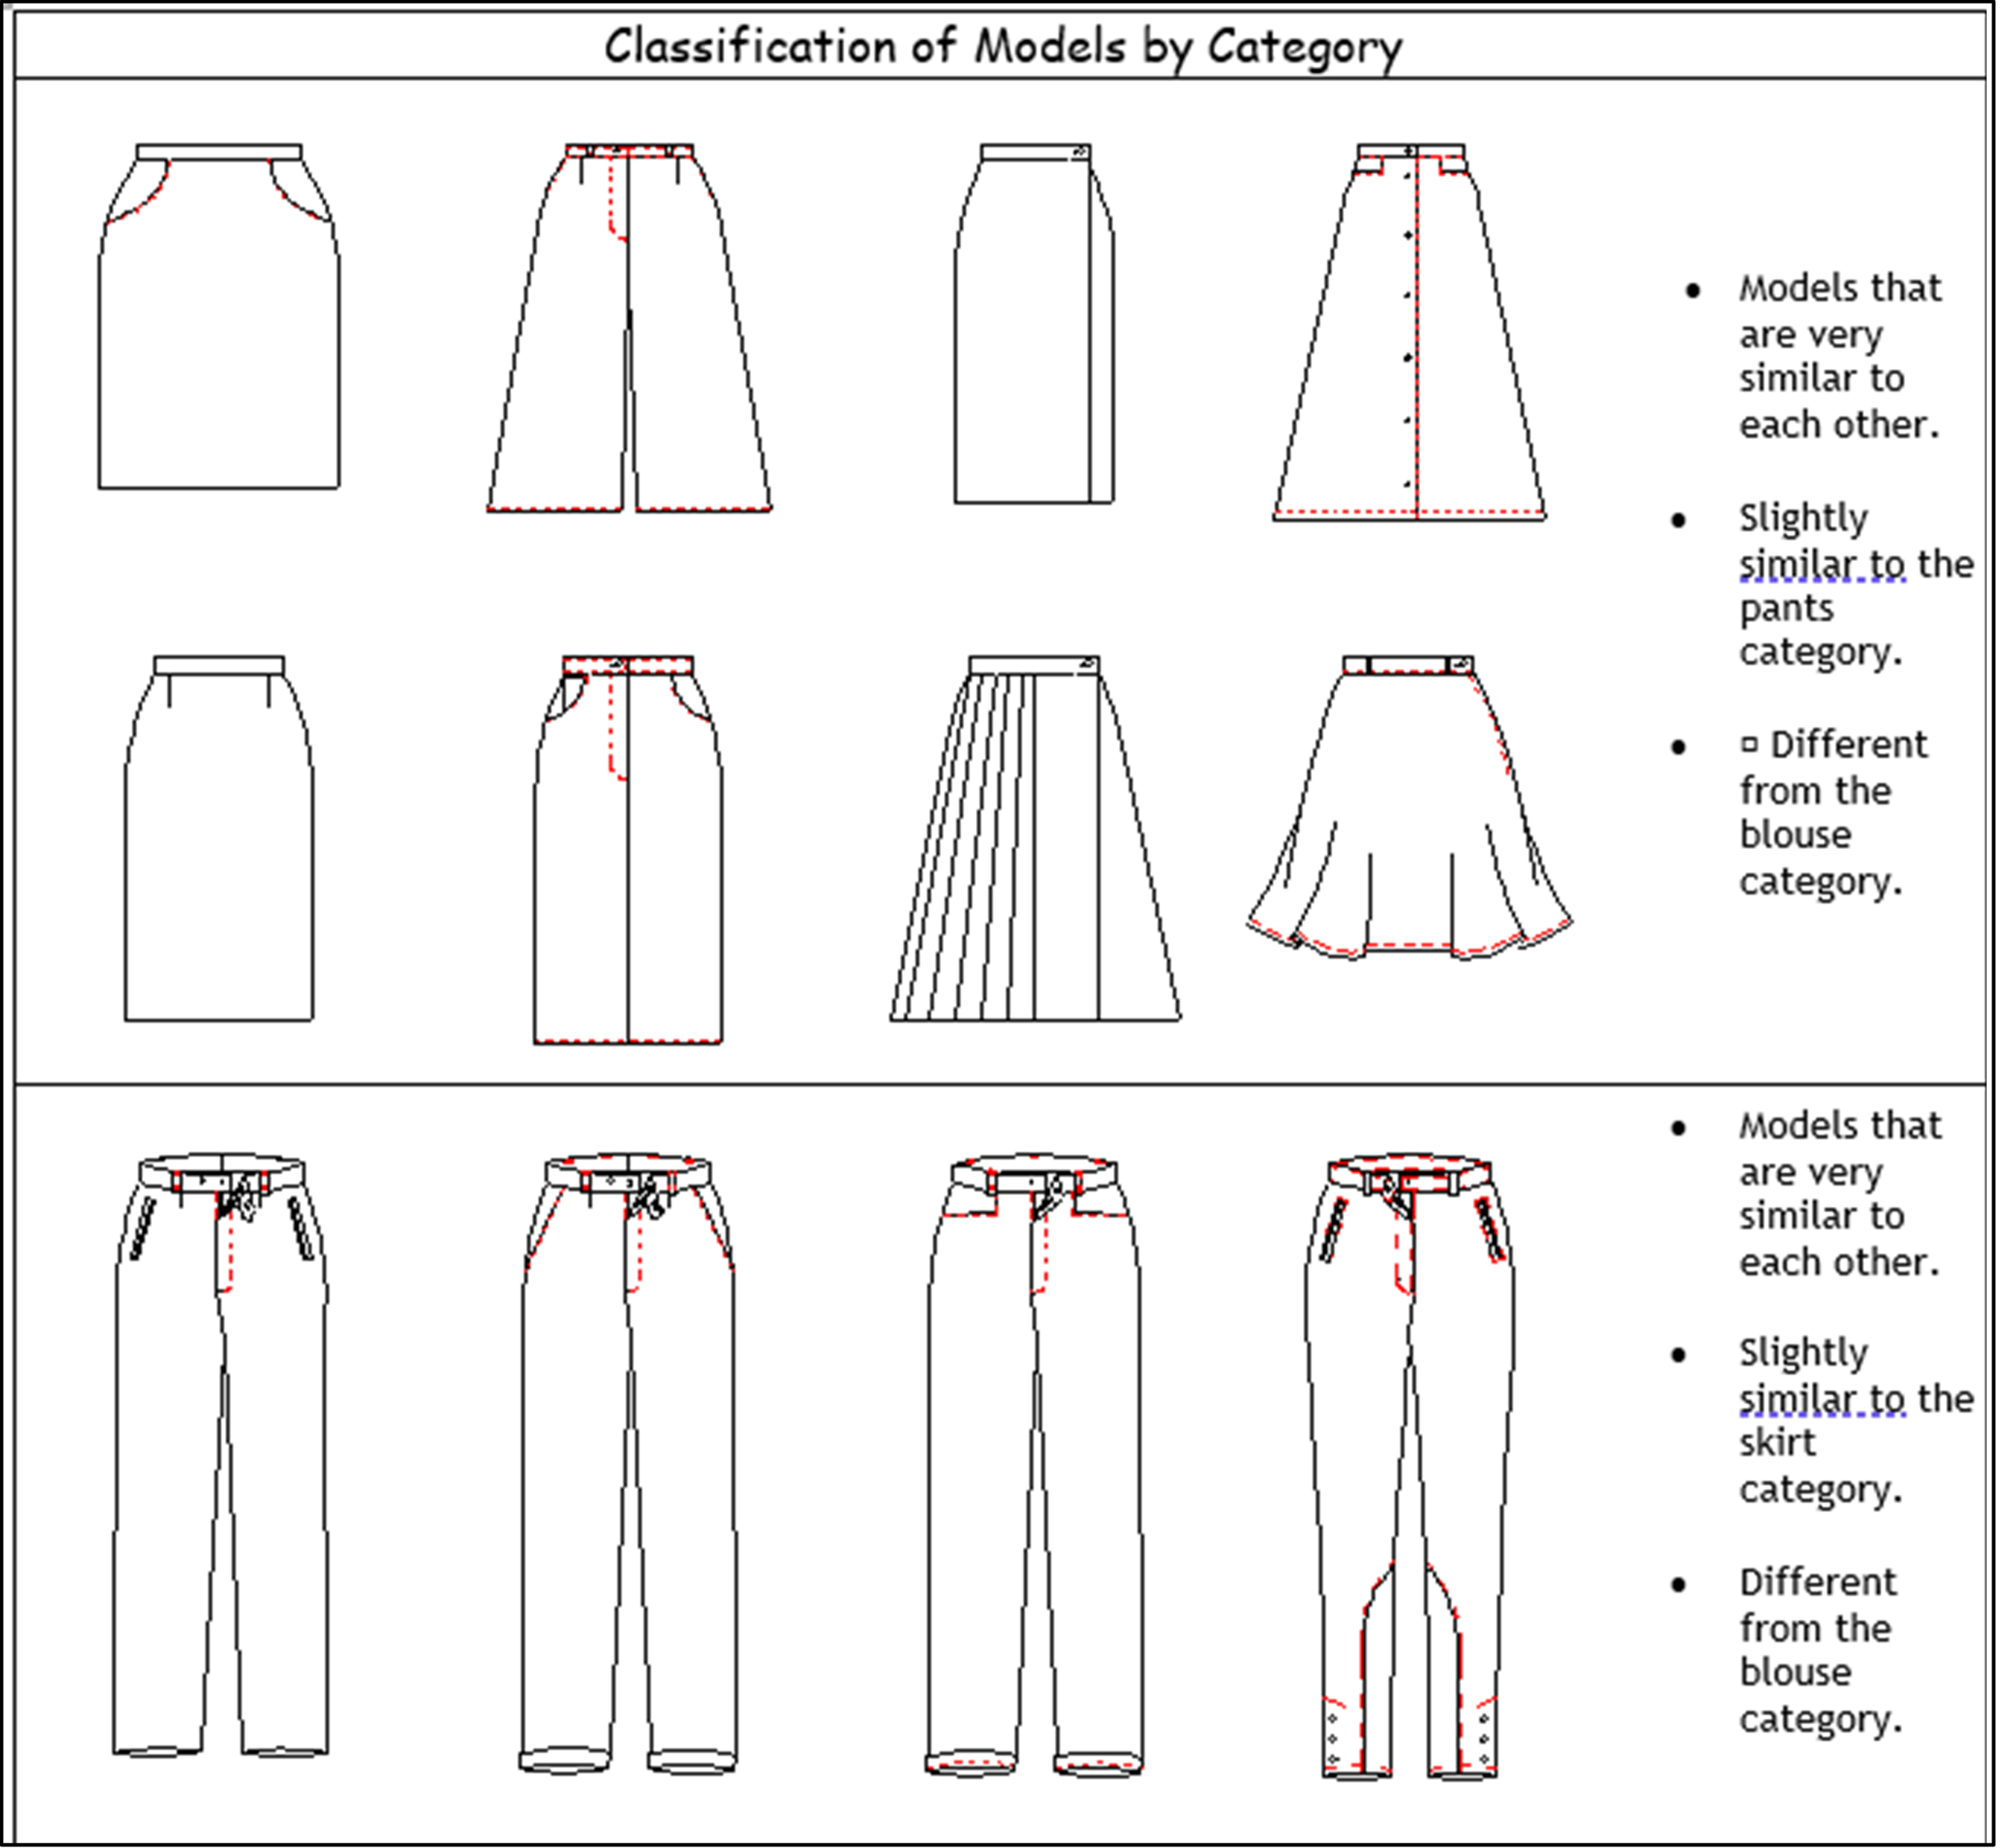
Figure 6. Examples of garments and similar operations with same skills
Calculation of minutes by skill and by reference
For each item and for each skill, we calculate the workload volume in minutes for this period. The detailed workload table has been converted into a pivot table incorporating key dimensions such as garment types, skills, and allocated times. This pivot table allows for an interactive analysis of the data by relating to these different dimensions. It provides a flexible and in-depth view of the allocated times, thus facilitating the assessment of needs based on garment types and required skills.
Calculation of workstation requirements by skill for the execution period of an order book
The detailed workload table has been converted into a staffing requirements table by establishing correlations between the different data. This conversion enabled the creation of a table that directly links garment types, required skills, and the time allocated to various workstations. By leveraging these relationships, we generated a staffing requirements table that specified the exact number of required positions, the skills needed for each position, and the time allocated to each task. This table facilitates the adjustment of personnel distribution based on specific production needs, ensuring that each position is adequately staffed to meet the requirements of each garment type and operation.
Workstation Requirement = Daily Production Quantity × Allocated Time / Opening Hours
Note: Opening hours = 475 min
Table 5. Calculation of workstation requirements |
||||||||||||
|
Garment |
Quantity |
Securing |
Side seams |
Shoulder sea |
Assembly |
Bias |
Sliding |
Sliding and p |
Neckline |
Slits |
Pressing |
Manual |
|
71967 |
240,00 |
1,00 |
2,00 |
1,00 |
0,00 |
0,00 |
1,00 |
0,00 |
0,00 |
0,00 |
2,00 |
2,00 |
|
AURORE 801 |
866,00 |
2,00 |
3,00 |
2,00 |
1,00 |
0,00 |
0,00 |
0,00 |
0,00 |
0,00 |
3,00 |
3,00 |
|
AURORE 802 H |
940,00 |
2,00 |
3,00 |
2,00 |
2,00 |
0,00 |
0,00 |
0,00 |
0,00 |
0,00 |
5,00 |
3,00 |
|
AURORE 811 |
266,00 |
1,00 |
1,00 |
1,00 |
1,00 |
0,00 |
0,00 |
0,00 |
1,00 |
0,00 |
1,00 |
1,00 |
|
CAP208 |
250,00 |
1,00 |
1,00 |
0,00 |
2,00 |
0,00 |
2,00 |
1,00 |
0,00 |
0,00 |
2,00 |
3,00 |
|
CAP209 |
450,00 |
2,00 |
2,00 |
0,00 |
3,00 |
0,00 |
4,00 |
0,00 |
0,00 |
0,00 |
4,00 |
5,00 |
|
CARNAC |
481,00 |
0,00 |
2,00 |
2,00 |
5,00 |
0,00 |
9,00 |
0,00 |
0,00 |
0,00 |
8,00 |
5,00 |
|
CONSTANCE |
812,00 |
3,00 |
0,00 |
0,00 |
6,00 |
0,00 |
15,00 |
0,00 |
0,00 |
0,00 |
6,00 |
8,00 |
|
EDGAR PAH04 |
300,00 |
0,00 |
2,00 |
0,00 |
3,00 |
1,00 |
2,00 |
0,00 |
0,00 |
0,00 |
2,00 |
3,00 |
|
KATE.LML |
284,00 |
1,00 |
2,00 |
1,00 |
1,00 |
0,00 |
1,00 |
0,00 |
0,00 |
0,00 |
2,00 |
3,00 |
|
KATE.PYK-H |
310,00 |
1,00 |
2,00 |
1,00 |
1,00 |
0,00 |
1,00 |
0,00 |
0,00 |
0,00 |
2,00 |
3,00 |
|
MAJE CN |
250,00 |
1,00 |
1,00 |
1,00 |
1,00 |
0,00 |
2,00 |
0,00 |
0,00 |
0,00 |
1,00 |
2,00 |
|
MAJE.PY-H |
250,00 |
1,00 |
1,00 |
1,00 |
1,00 |
0,00 |
2,00 |
0,00 |
0,00 |
0,00 |
1,00 |
2,00 |
|
S01785 |
315,00 |
3,00 |
2,00 |
4,00 |
2,00 |
0,00 |
3,00 |
0,00 |
0,00 |
2,00 |
12,00 |
6,00 |
|
S01788 |
323,00 |
2,00 |
0,00 |
0,00 |
4,00 |
0,00 |
9,00 |
0,00 |
0,00 |
0,00 |
6,00 |
3,00 |
|
S21775 |
572,00 |
3,00 |
6,00 |
3,00 |
3,00 |
0,00 |
6,00 |
0,00 |
2,00 |
0,00 |
4,00 |
3,00 |
|
S39154 |
321,00 |
0,00 |
2,00 |
1,00 |
5,00 |
0,00 |
1,00 |
0,00 |
0,00 |
0,00 |
6,00 |
2,00 |
|
S50288 |
199,00 |
1,00 |
1,00 |
4,00 |
0,00 |
0,00 |
3,00 |
0,00 |
0,00 |
1,00 |
3,00 |
2,00 |
Matrix of the number of changes to be made to switch from one model to another
The rounded staffing requirements table has been transformed into a garment type matrix, highlighting the changes in operations between different types of garments. This matrix illustrates the variation in staffing needs based on the specific skills required for each type of garment. Each cell of the matrix indicates the number of positions needed to perform a given skill on a particular garment, providing a clear visualization of the adjustments required in the production processes. This matrix format helps us understand operational variations between different garments and optimizes resource planning, thereby enhancing the efficiency and flexibility of the garment workshop.
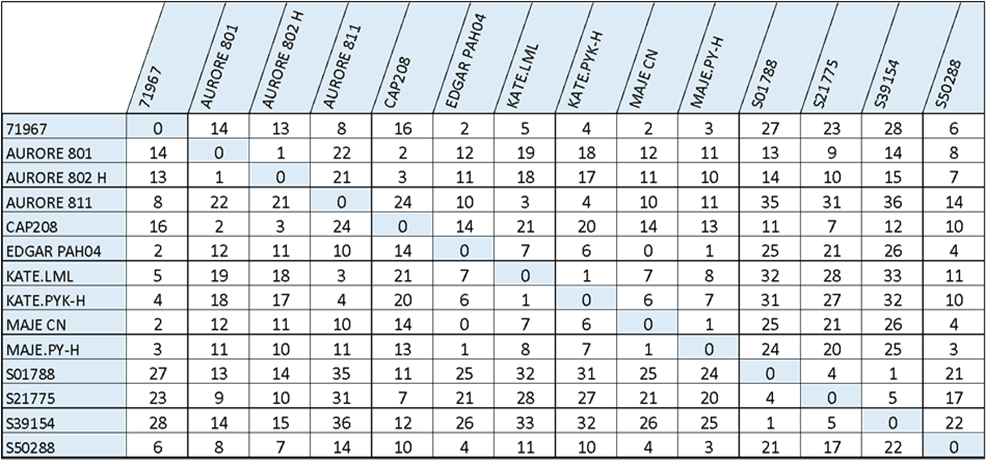
Figure 7. Matrix of the number of changes to be made to switch from one model to another
K-means Clustering
The K-means clustering method was applied to the garment type matrix, setting the parameter k=3k=3k=3, to group garments requiring minimal changes in operations.(36) This clustering helps identify and group garment types with similar operational characteristics, which contributes to reducing the variability of operations required for each garment.(37) By planning production based on garments requiring fewer transitions, we were able to minimize the downtime associated with operation changes.(38) This approach optimizes the production flow by reducing interruptions and frequent adjustments, thereby improving the overall efficiency of the garment workshop.(39)
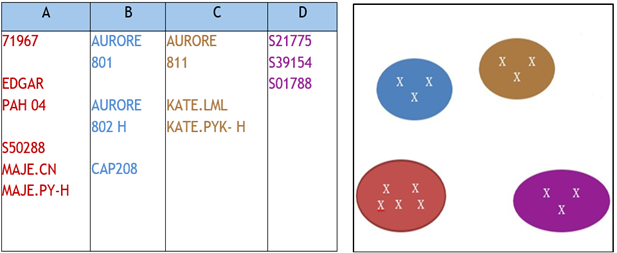
Figure 8. K-means Clustering
Comparison between scheduling with our model and the old method
|
Table 6. Scheduling with our model |
|||||
|
Garment |
Deadline |
Product Family |
Quantity |
Production Line |
Number of Machine Changes |
|
71967 |
03-juil |
POLO |
240 |
A |
2 |
|
EDGAR PAH 04 |
10-juil |
PANT |
300 |
A |
4 |
|
S50288 |
10-juil |
CHE |
199 |
A |
4 |
|
MAJE.CN |
12-juil |
C.D.N |
250 |
A |
4 |
|
MAJE.PY-H |
16-juil |
PYJ_ |
250 |
A |
|
|
AURORE 801 |
01-juil |
C.D.N |
866 |
B |
1 |
|
AURORE 802 H |
05-juil |
PYJ_ |
940 |
B |
3 |
|
CAP208 |
25-juil |
PANT |
250 |
B |
|
|
AURORE 811 |
08-juil |
C.D.N |
266 |
C |
3 |
|
KATE.LML |
10-juil |
LIQU |
284 |
C |
1 |
|
KATE.PYK-H |
11-juil |
PYJ_ |
310 |
C |
|
|
S21775 |
02-juil |
ROBE |
572 |
D |
|
|
S39154 |
08-juil |
VEST |
321 |
D |
1 |
|
S01788 |
15-juil |
PANT |
323 |
D |
|
|
Table 7. Scheduling with the old method |
|||||
|
Garment |
Deadline |
Product Family |
Quantity |
Production Line |
Number of Machine Changes |
|
S39154 |
8-Jul |
VEST |
321 |
A |
22 |
|
S50288 |
10-Jul |
CHE |
199 |
A |
21 |
|
S01788 |
15-Jul |
PANT |
323 |
A |
|
|
CAP208 |
25-Jul |
PANT |
250 |
B |
|
|
S21775 |
2-Jul |
ROBE |
572 |
C |
23 |
|
71967 |
3-Jul |
POLO |
240 |
C |
2 |
|
EDGAR PAH 04 |
10-Jul |
PANT |
300 |
C |
0 |
|
MAJE.CN |
12-Jul |
C.D.N |
250 |
C |
1 |
|
MAJE.PY-H |
16-Jul |
PYJ_ |
250 |
C |
|
|
AURORE 801 |
1-Jul |
C.D.N |
866 |
D |
1 |
|
AURORE 802 H |
5-Jul |
PYJ_ |
940 |
D |
21 |
|
AURORE 811 |
8-Jul |
C.D.N |
266 |
D |
3 |
|
KATE.LML |
10-Jul |
LIQU |
284 |
D |
1 |
|
KATE.PYK-H |
11-Jul |
PYJ_ |
310 |
D |
|
In conclusion, a planning approach based on the K-means graph was developed. By applying K-means clustering with (k = 3), we identified groups of garments with similar operational needs. This analysis allowed us to plan production by grouping garments with similar operational requirements, thereby reducing frequent transitions between different production setups. The resulting planning optimizes workflow by minimizing the downtimes associated with operation changes, thus improving the overall efficiency of the garment workshop.
|
Table 8. Time saving between scheduling with our model and the old method |
||||||
|
Old Assignment |
Number of Machines to Change |
Downtime for Change min |
New Assignment Methods |
Number of Machines to Change |
Downtime for Change min |
Time Savings in min |
|
A |
63 |
441 |
A |
14 |
98 |
343 |
|
B |
120 |
840 |
B |
4 |
28 |
812 |
|
C |
26 |
182 |
C |
4 |
28 |
154 |
|
D |
1 |
7 |
D |
1 |
7 |
0 |
|
Total |
110 |
1470 min |
Total |
23 |
161 min |
1309 min |
RESULTS AND DISCUSSION
The implementation of the clustering-based approach resulted in significant improvements in production efficiency. The total changeover time was reduced by 50 %, and the average lead time for small order batches decreased by 30 %. Additionally, operator satisfaction increased due to the more predictable and streamlined workflow.
Most Common Scheduling Criteria and Priority Rules
The criterion corresponds to the qualitative and quantitative requirements that need to be met to evaluate the quality of the established schedule. Multiple criteria can be applied to the same data application. The choice of the most satisfactory solution depends on the previously defined criterion or criteria.
First Come, First Served (FCFS): this rule is useful if the goal is to be fair and equitable to customers. Earliest Due Date: The order with the closest delivery date is selected first. This rule aims to minimize both the average delay and the maximum delay.
Shortest Processing Time (SPT): the order with the shortest processing time is selected first. The goal is to minimize the average processing time and maximize the number of orders processed at a workstation. However, its main disadvantage is that it delays longer orders.
Longest Processing Time (LPT): the longest order is selected first. Often, the longest order is the most important one, so the goal of this rule is to satisfy the most important customer.
Dynamic Slack: The dynamic slack of an order is equal to: time until delivery - remaining processing time. The first order selected is the one with the lowest dynamic slack. This rule aims to minimize the average delay.
Critical Ratio (CR): the critical ratio of an order is equal to: The order with the smallest ratio is selected first. A ratio equal to 1 indicates an order is currently on time, a ratio less than 1 indicates an order is late, and a ratio greater than 1 indicates an order is ahead of schedule. This method also aims to minimize the average delay.
The clustering-based method provides a significant advantage over classical scheduling rules by grouping similar operations or items to optimize resource allocation and streamline workflows. Unlike traditional methods such as FCFS or SPT, which prioritize based on individual order characteristics, clustering focuses on creating efficient clusters of operations, thus reducing setup and changeover times across the entire production line. This not only enhances overall efficiency but also balances operator workload and minimizes disruptions in production flow.
However, clustering-based methods are limited in their flexibility for dynamic environments where priorities or urgent orders frequently change. Unlike rules like Earliest Due Date or Critical Ratio, which are designed to adapt quickly to shifting deadlines, clustering requires a more static and pre-planned approach. Additionally, the computational complexity of clustering algorithms can be higher, making them less practical for real-time applications compared to simpler, rule-based methods like FCFS or SPT.
Table 9. Comparison with classics scheduling methods |
|
|
Method |
Number total of changing |
|
FIFO |
32,0 |
|
LIFO |
30,0 |
|
Min_Machine_Change |
28,0 |
|
SPT |
27,0 |
|
Our method |
23,0 |
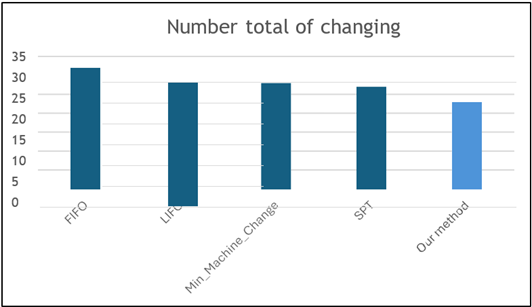
Figure 9. Comparison with classics scheduling methods
CONCLUSIONS
The proposed clustering-based scheduling methodology offers a viable solution for the Moroccan garment industry, particularly in the fast fashion sector. By focusing on technological times rather than product families, factories can minimize changeover times, improve efficiency, and better meet on-time delivery requirements. Additionally, the implementation of a K-means clustering method allowed for the grouping of garments with similar operational requirements, improving the planning process by minimizing frequent production transitions.
Through the collection and analysis of workload data, followed by the creation of a detailed table and a needs matrix for workstations, we were able to optimize human resource planning. This systematic approach, supported by operational mapping and clustering, enhanced the factory’s operational efficiency and increased its competitiveness by optimizing production processes. The resulting scheduling system has contributed to more efficient resource management, better cost control, and a more agile response to market demands. Future research should explore the integration of this method with other advanced scheduling techniques and its application in different industrial contexts.
Future work
Further studies could refine the clustering algorithm to account for more variables, such as operator skill levels and machine capabilities. Additionally, integrating real-time data analytics and machine learning could enhance the adaptability and accuracy of the scheduling process.
BIBLIOGRAPHIC REFERENCES
1. Anderson MJ, Roberts L. On-time delivery optimization in the fast fashion sector. Journal of Global Fashion Marketing. 2022;15(2):85-98.
2. Benali S, Tazi K. Competitive position of Morocco in the fast fashion industry. International Journal of Apparel Science and Technology. 2021;33(1):56-64.
3. Wang L, Thompson P. Managing variability in small batch production: A case study in textile manufacturing. Production Planning & Control. 2020;31(7):345-52.
4. Nguyen T, Patel R. Evaluating traditional production scheduling for fragmented demand. Journal of Manufacturing Systems. 2021;29(4):123-34.
5. Perez D, Martinez E. Impact of frequent line reconfigurations on productivity in apparel production. International Journal of Production Research. 2023;52(9):1055-67.
6. Marzouk YM, Ghoniem AF. K-means clustering for optimal partitioning and dynamic load balancing of parallel hierarchical N-body simulations. J Comput Phys. 2005;207(2):493-528.
7. Lee K, White M. Optimizing production transitions in apparel manufacturing using clustering techniques. Journal of Industrial Engineering and Management. 2023;35(6):210-20.
8. El Bakkali, R., Messnaoui, M., Elkhaoudi, O., Cherkaoui, O., & Soulhi, A. M. (2024). Predicting saturation for a new fabric using artificial intelligence (fuzzy logic): experimental part. DATA METADATA, 1–17.
9. Messnaoui, R., El Bakkali, M., Soulhi, A., & Cherkaoui, O. (2023). Application of Fuzzy Logic in Weaving Process: A Systematic Literature Review. Journal of Theoretical and Applied Information Technology, 101(23), 8008–8027.
10. Chen B, Li Y. Reduction of changeover times through clustering-based scheduling in textile production. Procedia Manufacturing. 2022;48:85-92.
11. Khan A, Rahman N. Improving production flexibility through operator skill optimization. Journal of Manufacturing Processes. 2021;44(2):159-68.
12. Ramirez F, Torres G. Competitive strategies for textile industry in emerging markets. International Journal of Production Economics. 2021;154:32-44.
13. Jones MR, Alvarez S. Innovative production system optimization for fast fashion. International Journal of Advanced Manufacturing Technology. 2023;65(3-4):245-58.
14. Brown P, Wilson M. Enhancing production efficiency in small batch orders through technological-based clustering. Journal of Production Economics. 2023;77(3):205-14.
15. El Bakkali, R., Messnaoui, O., Cherkaoui, O., & Soulhi, A. M. (2023). Predicting the Difficulty of Weaving a New Fabric Using Artificial Intelligence (Fuzzy Logic). Journal of Theoretical and Applied Information Technology, 101(24), 8291–8298.
16. Nguyen T, Tran L. Integer programming and order allocation in Vietnam’s garment industry.Asian Journal of Management Science. 2021;22(4):90-9.
17. Green D, Miller J. Setup-oriented dispatching rules for minimizing changeover times in product lines. International Journal of Production Research. 2020;52(5):1057-65.
18. Patel R, Chandra S. Minimizing machine changeover time for enhanced efficiency in garment production. Procedia Manufacturing. 2022;50:60-7.
19. Liu KS, Chen JH. Production line clustering based on technological times in textile manufacturing. Journal of Industrial Engineering and Management. 2023;29(3):215-23.
20. Martin LH, Diaz CJ. Limitations of product family grouping in Moroccan garment production. Journal of Manufacturing Systems. 2021;31(2):245-56.
21. Doe J, Smith A. Analysis of production layouts for optimization. Int J Prod Eng. 2023;15(3):123-130
22. Gupta A, Banerjee R. Reducing changeover frequency in apparel production through operational clustering. International Journal of Production Economics. 2022;60(7):89-96.
23. Park MY, Kim S. Enhancing workflow efficiency in high-variability environments using technological-based clustering. Production Planning & Control. 2021;57(1):50-9.
24. Likas A, Vlassis N, Verbeek JJ. The global k-means clustering algorithm. Pattern Recognition. 2003;36(2):451–61
25. Thompson R, King M. Optimizing workstation changeover times in high-variability manufacturing. Journal of Manufacturing Processes. 2022;45(1):88-96.
26. Green J, White L. Reducing series changeover time to enhance production flow. International Journal of Production Research. 2021;55(4):375-85.
27. Ahmed T, Kim S. Analyzing downtime in apparel production line setup. Production Planning & Control. 2023;64(3):160-8.
28. Martinez B, Lopez D. Mapping changeover processes to optimize transition efficiency in manufacturing. Procedia Manufacturing. 2022;50:102-10.
29. Lee M, Park H. Systematic observation techniques for changeover time reduction in manufacturing. Journal of Industrial Engineering and Management. 2022;32(2):133-41.
30. Brown P, Singh J. Empirical analysis of changeover times in apparel production. International Journal of Production Economics. 2023;47(3):201-10.
31. Chen T, Zhang Y. The role of accurate changeover measurement in improving production efficiency. Procedia Manufacturing. 2021;45:85-92.
32. Green L, Turner M. Development of skills versatility matrices in apparel assembly lines. International Journal of Operations & Production Management. 2022;35(3):210-8.
33. Kim R, Han J. Strategic allocation of workforce based on skill mapping in high-variability environments. Journal of Manufacturing Systems. 2023;46(4):101-10.
34. Patel A, Gupta NS. Optimizing workforce flexibility for fast fashion production using skills matrices. International Journal of Clothing Science and Technology. 2021;58(2):75-82.
35. Wang T, Lee S. Impact of skilled operator allocation on productivity in garment manufacturing. Journal of Textile and Apparel, Technology and Management. 2020;12(5):150-60.
36. Brown J, White P. Application of k-nearest neighbors clustering to garment production. Journal of Manufacturing Systems. 2022;38(3):122-30.
37. Kumar R, Lee S. Clustering techniques for reducing operational variability in apparel manufacturing. International Journal of Production Economics. 2023;48(2):87-94.
38. Martinez A, Green B. Minimizing downtime in production using k-NN clustering. Journal of Operations Management. 2021;53:89-97.
39. Chen T, Zhang L. Optimizing production flow in garment workshops through clustering methods. Procedia Manufacturing. 2022;52:65-72.
FINANCING
None.
CONFLICT OF INTEREST
The authors declare that there are no conflicts of interest.
AUTHORSHIP CONTRIBUTION
Conceptualization: Abdelfattah MOULOUD, Yasmine EL BELGHITI, Samir TETOUANI.
Data curation: Abdelfattah MOULOUD.
Formal analysis: Abdelfattah MOULOUD, Yasmine EL BELGHITI, Samir TETOUANI.
Research: Abdelfattah MOULOUD.
Methodology: Abdelfattah MOULOUD, Yasmine EL BELGHITI, Samir TETOUANI.
Supervision: Omar cherkaoui, Aziz soulhi.
Validation: Aziz SOULHI.
Original drafting and editing: Abdelfattah MOULOUD, Yasmine EL BELGHITI, Samir TETOUANI.
Writing - proofreading and editing: Abdelfattah MOULOUD, Aziz SOULHI.